

Introduction
New Zealand (NZ) beef production relies on high-quality pastures for feeding cattle (Hodgson et al., 2005). However, this system results in beef slaughter numbers that are highly dependent on the annual pasture cycle. Slaughter numbers lag behind the pasture growth curve peaking from January to May; slaughter facilities historically operate at reduced capacity from August through October when slaughter numbers are at their lowest (Charteris et al., 2000; Gibbs and Saldias, 2014). Diet-metabolizable energy also remains a limiting factor (Beef and Lamb New Zealand, 2012, 2017). As a result, many cattle in NZ are slaughtered at 26 to 36 mo of age (Gibbs and Saldias, 2014). In order to combat these issues, it is common practice for producers in NZ to partake in careful and intensive management of pastures and livestock (Charteris et al., 2000; Beef and Lamb New Zealand, 2017). Maintaining mixed pastures through incorporation of winter crops is also common. However, these crops generally have a relatively short window of effective grazing, low yields, and insufficient energy content to support animal growth (Gibbs and Saldias, 2014). Therefore, recent focus has shifted to further improvement of pastures through diversification to increase overall feeding value (Kemp et al., 2010; Macfarlane et al., 2014).
Fodder beet has been investigated as a possible winter crop to supplement cattle during low–pasture-quality months to promote growth and achieve earlier finishing (Gibbs and Saldias, 2014). Fodder beet, a member of the subspecies Beta vulgaris L., is a cross between sugar beet and mangel (Matthew et al., 2011). It is a highly energy-dense crop, with bulbs averaging >60% carbohydrate (Matthew et al., 2011). Because of its high energy density, cattle must be transitioned onto fodder beet similarly to grain-based diets to avoid ruminal acidosis; however, once cattle are transitioned, they are generally easy to maintain on fodder beet (Gibbs and Saldias, 2014). It also has potential for high dry matter yield >30 t ha−1, making fodder beet ideal for growing and finishing beef cattle (Matthew et al., 2011).
Nutrient composition of beef is directly affected by diet and nutrition. Variation in diet affects not only the quantity of lipids stored in fat depots but also the fatty acids (FA) that comprise those lipid stores. Content and composition of FA stored in animal tissue depots are directly influenced by the FA composition of the diet consumed by the animal closest to finishing (Wood et al., 2008). Therefore, it has been reported that meat from pasture-finished cattle contains greater concentrations of long-chain polyunsaturated FA (PUFA) and α-linolenic acid (C18:3n3) similar to those in forages compared to meat from grain-finished cattle; grain finishing generally results in greater concentrations of saturated and monounsaturated FA (SFA and MUFA, respectively), particularly linoleic acid, provided by grains (French et al., 2000; Wood et al., 2008; Schmidt et al., 2013). Content and composition of FA play important roles in shelf life and palatability of beef, making them an important consideration in beef production. Therefore, this research seeks to characterize the FA profiles of the neutral and polar lipid (NL and PL, respectively) fractions of beef from steers finished on fodder beet compared to traditional NZ grass-fed beef and United States grain-fed beef.
Materials and Methods
Carcass selection
All experimental procedures were conducted in accordance with a Texas Tech University Animal Care and Use Committee Protocol (Protocol #14016-04). Carcasses representing the experimental treatments were selected from 3,567 steers of a variety of breeds (including British purebred, Continental purebred, British crossbred, Continental crossbred, and British × Continental crossbred) following a nationwide feeding trial utilizing fodder beet (FB; Beta vulgaris subspecies Vulgaris L.) to finish beef steers during winter months in 2014. A full description of the feeding trial and selection process can be found in Garmyn et al. (2019). In short, 17 beef producers in NZ participated in the trial, and individualized feeding plans were organized to best fit each producer’s farm based on available FB acreage and yield. After an initial adaptation period (up to day 21) to transition steers onto FB, diets were composed of supplement (meadow hay or cereal straw recommended; limited to 2.5 kg of dry matter intake daily) and ad libitum access to FB. Steers were weighed at the start of the grazing period (day 0; average body weight [BW] =458.6 ± 45.0 kg) and at 60 d into the grazing period (average BW = 491.4 ± 48.0 kg) with an average daily gain of 0.5 kg through that period. If crop was still available, steers continued to graze for an additional 20 to 30 d. Steers that remained on pasture (797 head) were weighed again between 80 to 90 d of grazing (average BW = 522.2 ± 37.9 kg) and had an average daily gain of 1.0 kg. Steers enrolled in the FB feeding program that were selected for further assessment of eating quality and FA profiling were on FB crop for an average of 81 d (range 63–98 d) immediately prior to slaughter. Steers were slaughtered at one of 3 commercial abattoirs in NZ, but those selected for further analysis were obtained from a single abattoir.
Additional carcasses were selected from the same facility on the same slaughter days to represent non-FB (NFB) “grass-fed” treatments. Based on the New Zealand Animal Status Declaration mandated under the Animal Products Act of 1999, these animals were certifiably grass-fed and did not graze FB prior to slaughter (Garmyn et al., 2019).
Product selection
Strip loins were selected from a single commercial abattoir in Balclutha, NZ, over a series of 9 collection days during a 28-d period from July to August. Carcasses were chilled 18 to 24 h before grading and fabrication. Full selection details are reported in Garmyn et al. (2019), in which strip loins (n = 240 [60/treatment group]) representing low and high expected eating quality were selected within each finishing system (FB and NFB) based on eligibility for a NZ branded program that emphasizes marbling, ossification, and pH but also includes 12th rib fat and hot carcass weight. Selection resulted in 4 treatments: FB low quality (FBL), FB high quality (FBH), NFB low quality (NFBL), and NFB high quality (NFBH). Selected strip loins were vacuum packaged and stored on site at 2°C until steak fabrication.
Additional strip loins were selected from a commercial abattoir in Omaha, Nebraska, from 120 sides of US Department of Agriculture (USDA)-graded beef representing Top (upper Two-Thirds) Choice and Select quality grades (n = 120 [60/quality grade]). Carcasses were chilled approximately 18 to 24 h before grading. Fabrication time was dependent on resulting quality grade but occurred within 32 h postmortem. Strip loins were vacuum packaged and shipped under refrigeration to the Gordon W. Davis Meat Science Laboratory, Lubbock, Texas, and stored at 2°C until steak fabrication. As cattle in the US are primarily finished on corn-based diets (Samuelson et al., 2016), these treatments will be referred to as grain-fed comparatively to the NZ feeding programs. For all treatments, carcass data for selected carcasses were collected by trained Texas Tech personnel based on USDA standards (USDA, 1997) and are reported by Garmyn et al. (2019).
Steak fabrication
Strip loins were fabricated prior to 21 d postmortem in accordance with Meat Standards Australia protocols (Watson et al., 2008). Strip loins in NZ were fabricated on day 1 postmortem in the processing facility, and strip loins in the US were fabricated on day 7 postmortem upon arrival at the Texas Tech Meat Laboratory. Strip loins were denuded of external fat and connective tissue prior to steak fabrication. The gluteus medius was also removed, leaving only the longissimus lumborum. Longissimus muscles were fabricated into 2.5-cm-thick steaks that were assigned to one of 2 postmortem aging periods (21 d or 35 d), which were balanced within each treatment based on position to avoid any positional effect in regard to aging. One steak from each strip loin and aging period was retained for evaluation of FA. Steaks were vacuum packaged, stored at 2°C, and frozen at 21 or 35 d postmortem based on aging designation. After freezing, NZ beef was shipped frozen to the Texas Tech University Gordon W. Davis Meat Science Laboratory in Lubbock, Texas, via commercial air freight followed by frozen ground transport. Once delivered, steaks remained frozen until further analysis.
Sample preparation
Prior to analyses, individual steaks were thawed under refrigeration (2°C to 4°C) for 24 h, sliced, frozen in liquid nitrogen, and homogenized into a fine powder. Powdered samples were stored in individually identified bags at −80°C. A subset of samples was used for FA evaluation. Samples used for analysis were selected to represent each treatment collected on each slaughter date. As a result, 13 samples were selected from each NZ treatment. However, only 12 samples were selected from each US treatment as those were collected from a single slaughter date. Paired samples were selected from the same strip loin representing both aging treatments. A total of 152 samples was used to evaluate FA content and composition. Half (n = 76) of the samples were aged 21 d and half (n = 76) of samples were aged 35 d postmortem.
Lipid extraction and separation
Lipids were extracted using a USDA-approved chloroform:methanol method (AOAC 983.23) modified from the methods described by Folch et al. (1957) and Bligh and Dyer (1959). Chloroform and methanol were used at 2:1 (v/v) chloroform:methanol to extract the lipid portion from 1 g of frozen, homogenized sample. Homogenized samples with chloroform and methanol were filtered (Whatman no. 40) into 50-mL glass test tubes with Teflon-lined screw caps. The original tube was rinsed with 12 mL of 2:1 (v/v) chloroform:methanol for 5 s to remove any remaining residue. Potassium chloride (0.88% KCl; 8 mL) was added to the filtered samples and shaken for 10 min, then centrifuged for 5 min at 1,000g at ambient temperature. Following centrifugation, the top layer was aspirated. The bottom chloroform layer was transferred to a 15-mL glass test tube, and chloroform was evaporated to dryness under nitrogen. Dried samples were stored at −80°C until separation.
Lipid extracts were separated with chloroform and methanol using silica gel cartridges (Restek Corporation, Bellefonte, PA). Dried extracts were reconstituted with 2-mL chloroform, vortexed 5 s, and then transferred to the silica gel cartridge. Tubes were then rinsed again with 2-mL chloroform, vortexed 5 s, and transferred to the silica gel cartridge. Vacuum was applied to achieve a solvent flow rate of 0.5 mL/s. Test tubes were rinsed with 6 additional milliliters of chloroform, vortexed, and added to the silica gel cartridge. Cartridges were completely drained of chloroform, and chloroform portion was retained for NL. Methanol (15 mL) was added to the test tubes, vortexed, and transferred in 5-mL increments to the same silica gel cartridge as used for NL with a 0.5 mL/s flow rate. Methanol was completely drained from the cartridge, and the methanol portion was retained for PL. Solvents for both lipid fractions were evaporated under a nitrogen stream and stored at −80°C.
Preparation of fatty acid methyl esters
Fatty acid methyl esters (FAME) were prepared through a modification of the procedure described by Christie (1993). Lipid fractions were dissolved in 1 mL of internal standard-toluene solution; then, 2 mL of 0.5 N sodium methoxide in methanol was added, and samples were capped and vortexed. Fractions were heated in a 50°C water bath with shaker for either 10 min (NL) or 5 min (PL), and then removed. Glacial acetic acid (0.1 mL) and high-performance liquid chromatography nano-pure water (5 mL) were added to heated tubes, and tubes were vortexed. Following vortexing, 5 mL of hexane was added, and tubes were agitated for 5 min on a shaker. Tubes were centrifuged for 10 min at 1,000g at ambient temperature, and then the upper organic layer was transferred to a clean 15-mL polypropylene tube. Hexane rinse and removal of the upper organic layer was repeated. Anhydrous sodium sulfate was added, and samples were vortexed and then allowed to rest for 5 min. The organic layer was then removed to another clean 15-mL polypropylene tube and concentrated to the desired level. Aliquots (2 mL) were transferred into 2 glass gas chromatography vials and stored at −80°C until analysis.
Quantification of FA
FAME were separated and quantified using an Agilent 6890N gas chromatograph (Agilent Technologies, Santa Clara, CA) equipped with an HP-88 capillary column (30 m × 250 μm × 0.2 μm; Agilent Technologies, Santa Clara, CA) and a flame-ionization detector. The NL samples were evaluated with a split ratio of 20:1, and the PL samples were evaluated with a split ratio of 3:1. For both NL and PL, inlet temperature was set to 250°C with an inlet pressure of 10.3 pounds per square inch. The PL had total flow of 10.8 mL/min, and the NL had a total flow of 44.2 mL/min. The initial oven temperature was 35°C, which was held for 2 min. The oven temperature was then ramped up to 120°C for 5 min at a rate of 6°C/min, then 170°C at a rate of 2°C/min (no hold), and then to a final temperature of 220°C at a rate of 6°C/min with temperature held for 1 min. Hydrogen was used as a carrier gas at a flow rate of 2 mL/min. Authentic FAME standards (Supelco 37 component FAME Mix, Sigma-Aldrich, St. Louis, MO) were used to identify FAME, and internal standard calibration was used for quantification. Percentages of total FA (TFA) were calculated using the following equation:
Statistical analyses
Data were analyzed as a completely randomized design using PROC GLIMMIX of SAS version 9.4 (SAS Institute Inc., Cary, NC) with feeding treatment, aging period, and their interaction as fixed effects. Denominator degrees of freedom were adjusted using the Kenward-Rogers adjustment. Significance was detected at α = 0.05. Treatment least-squares means were separated with the PDIFF option of SAS using a significance level of P ≤ 0.05. Mean separation tests for all pairwise comparisons were performed using the PDIFF function, which requests that P values for differences of all least-squares means be produced.
Results
FA totals
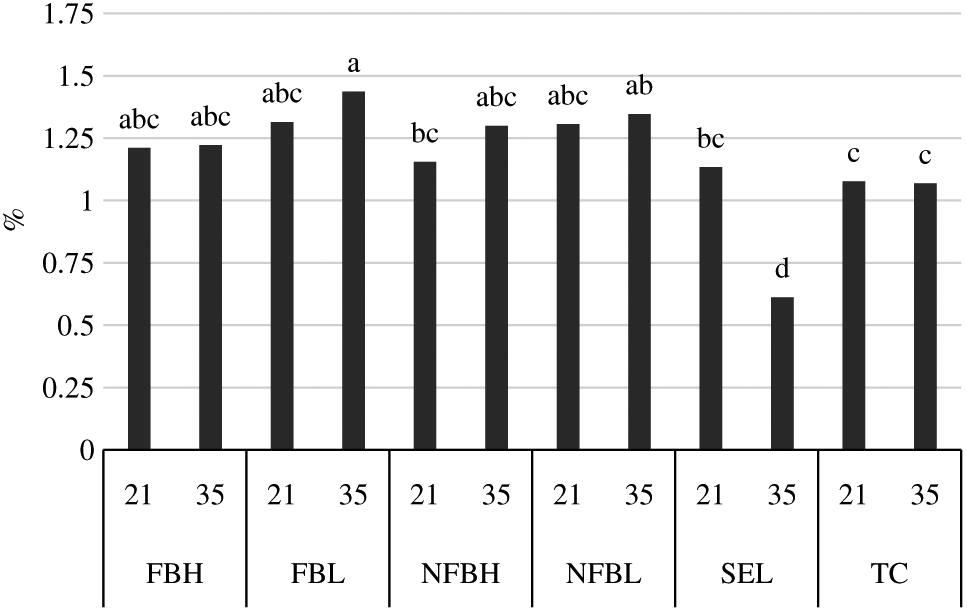
Figure 1 shows the TFA derived as the sum of all individual FA in both the PL and NL fractions. No interactions between treatment and aging occurred (P = 0.94). Differences were present among treatments (P < 0.01) for TFA. Samples from Top Choice had greater (P < 0.05) TFA than all other treatments. Samples from FBH had greater (P < 0.05) TFA than Select, FBL, and both NFB treatments. Samples from Select had greater (P < 0.05) TFA than NFBL but were similar (P > 0.05) to FBL and NFBH, which also did not differ (P > 0.05) from NFBL. No differences in TFA were present among different aging periods (P = 0.14).
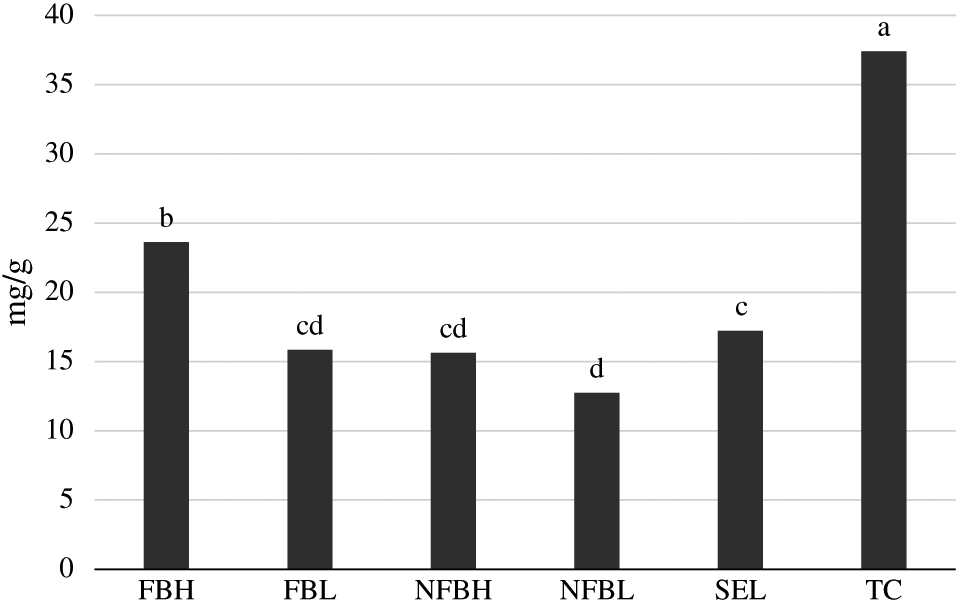
Total fatty acids derived from the longissimus lumborum of steers finished on fodder beet or non-fodder beet forages (FB, NFB, respectively) and carcasses classified as high or low predicted eating quality based primarily on marbling in the longissimus muscle and ossification (H, L, respectively) or carcasses of USDA Select or Top Choice (SEL, TC, respectively) quality grades following aging under vacuum at 4°C for either 21 d or 35 d derived as the sum of all individual fatty acids in the polar and neutral lipid fractions. Treatments without common superscripts differ. No differences due to aging were present (P > 0.05), and no interactions between diet and aging occurred (P > 0.05). Largest standard error of the mean = 1.4352
Composition of the NL fraction
The percentages of SFA, MUFA, and PUFA making up the NL fraction are displayed in Figure 2. There were no interactions of treatment and aging (P > 0.05) for the proportions of the 3 classes of FA in the NL fraction. Additionally, no differences occurred due to aging (P > 0.05). However, the proportions of all 3 classes differed among treatments (P < 0.01). The proportion of SFA was greater (P < 0.05) in both NFB treatments than both US treatments. Proportions of SFA in the FB treatments were similar (P > 0.05) to those of the NFB treatments and those of Select but were greater (P < 0.05) than proportions of SFA in Top Choice; proportions of SFA in Top Choice and Select were similar (P > 0.05). As a result of the lower proportion of SFA, Top Choice had a greater (P < 0.05) proportion of MUFA than all other treatments, which had a similar (P > 0.05) proportion of MUFA. Finally, the proportion of PUFA was greater (P < 0.05) in Select than in Top Choice and greater (P < 0.05) in Top Choice than both NFB treatments, which were similar (P > 0.05), and the proportion of PUFA was greater (P < 0.05) in both NFB treatments than in both FB treatments, which were also similar (P > 0.05).
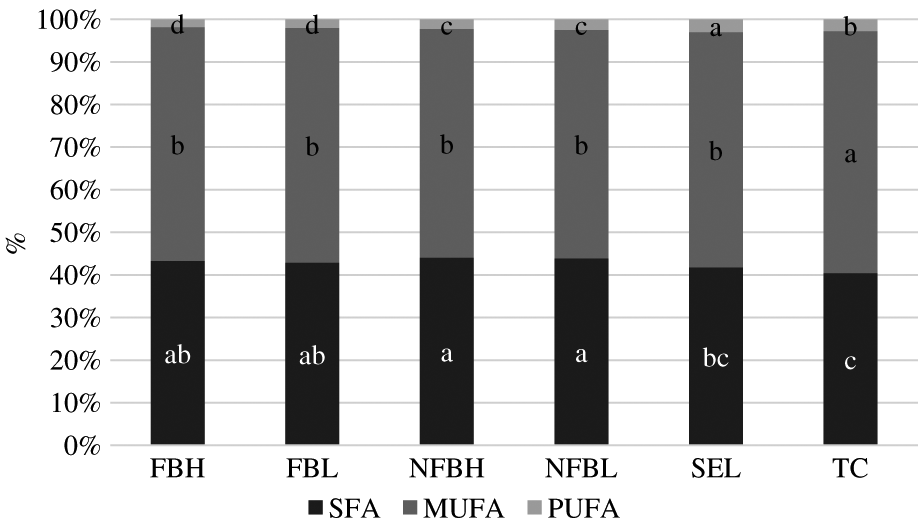
Percentages of saturated fatty acids (SFA), monounsaturated fatty acids (MUFA), and polyunsaturated fatty acids (PUFA) making up the neutral lipid fraction of fatty acids derived from the longissimus lumborum of steers finished on fodder beet or non-fodder beet forages (FB, NFB, respectively) and carcasses classified as high or low predicted eating quality based primarily on marbling in the longissimus muscle and ossification (H, L, respectively) or carcasses of USDA Select or Top Choice (SEL, TC, respectively) quality grades following aging under vacuum at 4°C for either 21 d or 35 d. Within a FA type, treatments without a common superscript differ (P < 0.05). No differences occurred due to aging (P > 0.05), and no interactions between diet and aging were present (P > 0.05). Largest standard error of the mean = 0.5702.
The total NL and proportions of individual FA that make up the major groups of FA are outlined in Table 1. TFA in the NL fraction ranged from 10.621 to 34.739 mg/g and differed due to treatment (P < 0.01) but did not differ due to aging (P = 0.16) or the interaction of treatment and aging (P = 0.90). Following the pattern of the overall TFA, total concentrations of FA in the NL fraction were greater (P < 0.05) in Top Choice than all other treatments and greater (P < 0.05) in FBH than all remaining treatments. TFA in the NL fraction in Select did not differ (P > 0.05) from that in FBL and NFBH but was greater (P < 0.05) than in NFBL, which also did not differ (P > 0.05) from FBL and NFBH. Percentages of FA in the NL fraction make up these totals. A total of 13 FA were consistently identified in the NL fraction: C14:0 (myristic acid), C15:0 (pentadecylic acid), C16:0 (palmitic acid), C17:0 (margaric acid), C18:0 (stearic acid), C14:1 (myristoleic acid), C16:1 (palmitoleic acid), C17:1 (heptadecenoic acid), C18:1n9t (elaidic acid), C18:1n9c (oleic acid), C20:1 (gondoic acid), C18:2 (linoleic acid), and C18:3n3 (α-linolenic acid). Palmitic, stearic, and oleic acids made up >80% of the FA in the NL fraction in all treatments. Aging did not affect the percentages of any individual FA (P > 0.05).
Percentages of fatty acids making up the neutral lipid fraction of fatty acids derived from steers finished on fodder beet or non–fodder beet forages or traditional US grain-based diets aged under refrigeration until 21 or 35 d postmortem
| Treatment1 | Aging | Treatment × Aging | ||||||||||||
|---|---|---|---|---|---|---|---|---|---|---|---|---|---|---|
| Fatty acid, % | FBH | FBL | NFBH | NFBL | SEL | TC | SEM2 | P values | 21 | 35 | SEM | P values | SEM | P values |
| Total NL, mg/kg | 21.032b | 13.885c,d | 13.585c,d | 10.621d | 15.240c | 34.739a | 1.4570 | <0.001 | 19.008 | 17.359 | 0.8201 | 0.158 | 2.0605 | 0.895 |
| SFA | ||||||||||||||
| C14:0 | 2.905 | 2.807 | 2.932 | 2.848 | 2.897 | 2.879 | 0.1002 | 0.957 | 2.862 | 2.894 | 0.0564 | 0.683 | 0.1417 | 0.999 |
| C15:0 | 0.539b,c | 0.558b,c | 0.539b,c | 0.753a | 0.606b | 0.480c | 0.0354 | <0.001 | 0.578 | 0.580 | 0.0200 | 0.961 | 0.0501 | 0.116 |
| C16:0 | 25.624a | 24.771a,b | 24.725a,b | 24.480b | 23.396c | 24.568b | 0.3634 | 0.002 | 24.531 | 24.657 | 0.2046 | 0.664 | 0.5139 | 0.997 |
| C17:0 | 1.026c | 1.271a,b | 1.120b,c | 1.291a | 1.207a,b | 1.037c | 0.0566 | 0.001 | 1.150 | 1.168 | 0.0319 | 0.688 | 0.0801 | 0.674 |
| C18:0 | 13.212c | 13.451b,c | 14.720a | 14.505a,b | 13.683a,b,c | 11.477d | 0.4011 | <0.001 | 13.535 | 13.480 | 0.2258 | 0.864 | 0.5672 | 0.992 |
| MUFA | ||||||||||||||
| C14:1 | 0.974 | 0.870 | 0.893 | 0.990 | 0.919 | 0.842 | 0.0460 | 0.142 | 0.924 | 0.906 | 0.0259 | 0.615 | 0.0650 | 0.459 |
| C16:1 | 4.311a | 4.246a,b | 3.975b,c | 4.010a,b,c | 3.750c | 3.669c | 0.1274 | 0.002 | 3.985 | 4.002 | 0.0717 | 0.874 | 0.1801 | 0.993 |
| C17:1 | 1.007b | 1.226a | 0.983b | 1.121a | 0.994b | 0.795c | 0.0401 | <0.001 | 1.008 | 1.034 | 0.0226 | 0.402 | 0.0567 | 0.761 |
| C18:1n9t | 2.148c | 2.289c | 2.247c | 2.747c | 4.323b | 5.454a | 0.3175 | <0.001 | 3.259 | 3.144 | 0.1452 | 0.567 | 0.4660 | 0.985 |
| C18:1n9c | 45.726a | 45.854a | 44.858a,b | 43.917b | 46.403a | 45.614a | 0.5745 | 0.035 | 45.277 | 45.513 | 0.3234 | 0.607 | 0.8125 | 0.956 |
| C20:1 | 0.685c | 0.770b,c | 0.743c | 0.863a,b | 0.775a,b,c | 0.891a | 0.0419 | 0.005 | 0.792 | 0.784 | 0.0236 | 0.797 | 0.0593 | 0.851 |
| PUFA | ||||||||||||||
| C18:2 | 1.089b | 1.145b | 1.221b | 1.285b | 2.653a | 2.499a | 0.0795 | <0.001 | 1.675 | 1.622 | 0.0448 | 0.400 | 0.1124 | 0.836 |
| C18:3n3 | 0.755c | 0.841c | 1.045b | 1.190a | 0.372d | 0.237e | 0.0374 | <0.001 | 0.726 | 0.754 | 0.0211 | 0.340 | 0.0529 | 0.964 |
Treatments include fodder beet high quality (FBH), fodder beet low quality (FBL), non–fodder beet high quality (NFBH), non–fodder beet low quality (NFBL), USDA Select (SEL), and USDA Top Choice (TC).
SEM: largest standard error of the least-squares means.
Values with unlike superscripts differ (P < 0.05).
MUFA = monounsaturated fatty acid; NL = neutral lipid; PUFA = polyunsaturated fatty acid; SFA = saturated fatty acid.
Within the SFA of the NL fraction, proportions of myristic acid did not differ (P = 0.96) among treatments; however, proportions of pentadecyclic acid, palmitic acid, margaric acid, and stearic acid did differ (P < 0.01). The proportion of pentadecyclic acid was greater (P < 0.05) in NFBL than in all other treatments. Samples from Select had a greater (P < 0.05) proportion of pentadecyclic acid than Top Choice but were similar (P > 0.05) to those in FBH, FBL, and NFBH. Proportions of pentadecyclic acid in Top Choice also did not differ (P > 0.05) from those in both FB treatments and NFBH. Palmitic acid was the most predominant SFA in all samples. Proportions in FBH were similar (P > 0.05) to those in FBL and NFBH but were greater (P < 0.05) than those in NFBL, Select, and Top Choice. Samples from Select had lower (P < 0.05) proportions of palmitic acid than all other treatments. Proportions of margaric acid were greater (P < 0.05) in NFBL than in all high-quality treatments (FBH, NFBH, and Top Choice) but did not differ (P > 0.05) from those in FBL and Select. Proportions of margaric acid in FBL and Select also did not differ (P > 0.05) from those in NFBH but were greater (P < 0.05) than in FBH and Select, which had lower (P < 0.05) proportions of margaric acid than all other treatments except NFBH (P > 0.05). Proportions of stearic acid were greater (P < 0.05) in NFBH than in Top Choice and both FB treatments. Samples from NFBL had similar (P > 0.05) proportions of stearic acid to NFBH but also had similar (P > 0.05) proportions to Select and FBL. Samples from FBH had lower (P < 0.05) proportions of stearic acid than both NFB treatments but did not differ (P > 0.05) from FBL or Select. Finally, Top Choice had the lowest (P < 0.05) percentage of FA in the NL fraction composed of stearic acid.
Within the MUFA, proportions of myristoleic acid did not differ (P = 0.14) among treatments, but proportions of the remaining 5 MUFA did (P < 0.05). Proportions of palmitoleic acid were greater (P < 0.05) in both FB treatments than in Top Choice or Select. Additionally, FBH had greater (P < 0.05) proportions of palmitoleic acid than NFBH. Both NFB treatments had similar (P > 0.05) proportions of palmitoleic acid to both US treatments. Proportions of heptadecenoic acid were greatest (P < 0.05) in both NZ low-quality treatments (FBL and NFBL). Samples from FBH, NFBH, and Select had similar (P > 0.05) proportions of heptadecenoic acid to each other. All had greater (P < 0.05) proportions of heptadecenoic acid than Top Choice, which had the lowest (P < 0.05) proportion of this FA. Proportions of elaidic acid were greater (P < 0.05) in both US treatments than all NZ treatments, which did not differ (P > 0.05). Additionally, Top Choice had a greater (P < 0.05) percentage of elaidic acid than Select. Oleic acid was the most predominant FA in the NL fraction. It was present in greater (P < 0.05) proportions in all FB and US treatments—which did not differ (P > 0.05)—than in NFBL. Proportions of oleic acid in NFBH did not differ (P > 0.05) from those in any other treatments. Finally, gondoic acid was present in greater (P < 0.05) proportions in Top Choice than in both FB treatments and NFBH. NFBL had greater (P < 0.05) proportions of gondoic acid than FBH and NFBH but did not differ (P > 0.05) from either US treatment or FBL. Proportions of gondoic acid did not differ (P > 0.05) in Select compared to any other treatment.
Only 2 PUFA were identified in the NL fraction: linoleic acid and α-linolenic acid. Proportions of both differed (P < 0.01) among treatments. Linoleic acid made up a greater (P < 0.05) proportion of the NL fraction in both US treatments, which were similar (P > 0.05), than all other treatments. The proportions of linoleic acid did not differ (P > 0.05) among any of the NZ treatments. Proportions of α-linolenic acid were greater (P < 0.05) in NFBL than in all other treatments. Samples from NFBH had lower (P < 0.05) proportions of α-linolenic acid than NFBL but greater proportions than both FB treatments and both US treatments. Proportions of α-linolenic acid in FBL and FBH did not differ (P > 0.05) but were greater (P < 0.05) than those in both US treatments. Finally, Select had greater (P < 0.05) proportions of α-linolenic acid than Top Choice, which had the lowest (P < 0.05) proportion of α-linolenic acid.
Composition of the PL fraction
The percentages of SFA, MUFA, and PUFA making up the PL fraction are displayed in Figure 3. There were no interactions of diet and aging (P > 0.05) for the proportion of the 3 major classes of FA in the PL fraction. Additionally, no differences occurred due to aging (P > 0.05). The proportions of MUFA and PUFA differed among treatment (P < 0.01), whereas the percentage of SFA did not (P = 0.27). Proportions of MUFA in Select were decreased (P < 0.05) compared to all other treatments; this decrease coincided with a corresponding increase (P < 0.05) in PUFA compared to all other treatments. All other treatments did not differ (P > 0.05) for proportions of MUFA or PUFA.
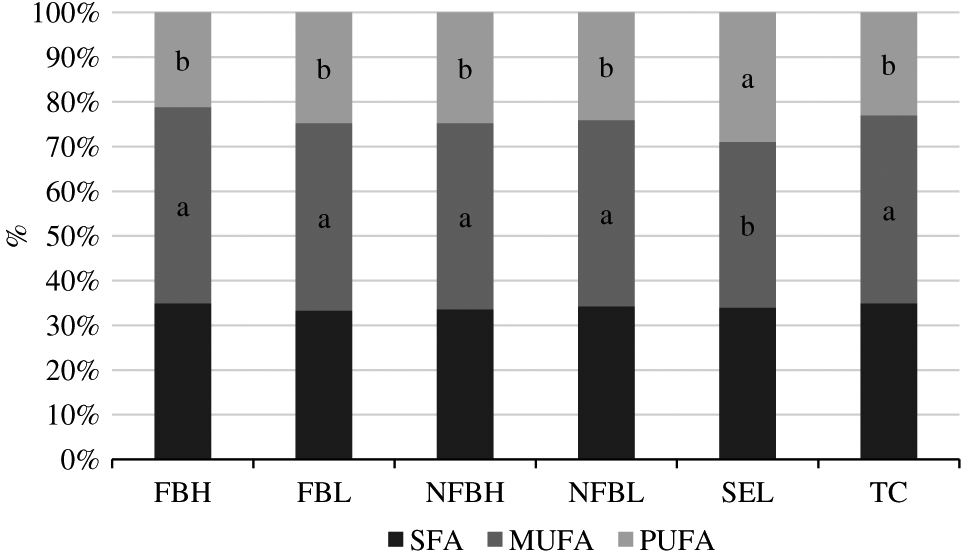
Percentages of saturated fatty acids (SFA), monounsaturated fatty acids (MUFA), and polyunsaturated fatty acids (PUFA) making up the polar lipid fraction of fatty acids derived from the longissimus lumborum of steers finished on fodder beet or non-fodder beet forages (FB, NFB, respectively) and carcasses classified as high or low predicted eating quality based primarily on marbling in the longissimus muscle and ossification (H, L, respectively) or carcasses of USDA Select or Top Choice (SEL, TC, respectively) quality grades following aging under vacuum at 4°C for either 21 d or 35 d. Within a FA type, treatments without a common superscript differ (P < 0.05). Percentages of SFA did not differ (P = 0.268) among treatments. No differences occurred due to aging (P > 0.05), and no interactions between diet and aging were present (P > 0.05). Largest standard error of the mean = 1.4015.
The total PL and the proportions of individual FA that make up the major groups of FA are outlined in Table 2. TFA in the PL fraction ranged from 1.954 to 2.678 mg/g and did not differ due to treatment (P = 0.08), aging (P = 0.72), or the interaction of treatment and aging (P = 0.85). Again, proportions of individual FA make up these totals. A total of 17 FA were consistently identified in the PL fraction: C10:0 (capric acid), myristic acid, palmitic acid, margaric acid, stearic acid, palmitoleic acid, heptadecenoic acid, elaidic acid, oleic acid, C22:1 (erucic acid), C24:1 (nervonic acid), linoleic acid, α-linolenic acid, C20:3n6 (dihomo-γ-linolenic acid), C20:5 (eicosapentaenoic acid [EPA]), C22:5n3 (docosapentaenoic acid [DPA]), and C22:6n3 (docosahexaenoic acid [DHA]). Palmitic, stearic, oleic, linoleic, and α-linolenic acids made up >75% of the TFA in the PL fraction of all treatments. Aging did not affect the percentages of any individual FA (P > 0.05). Interactions of treatment and aging were present for the proportions of myristic acid (P = 0.03) and margaric acid (P < 0.01).
Percentages of fatty acids making up the polar lipid fraction of fatty acids derived from steers finished on fodder beet or non–fodder beet forages or traditional US grain-based diets aged under refrigeration until 21 or 35 d postmortem
| Treatment1 | Aging | Treatment × Aging | ||||||||||||
|---|---|---|---|---|---|---|---|---|---|---|---|---|---|---|
| Fatty acid, % | FBH | FBL | NFBH | NFBL | SEL | TC | SEM2 | P values | 21 | 35 | SEM | P values | SEM | P values |
| Total PL, mg/kg | 2.584 | 1.954 | 2.045 | 2.114 | 1.982 | 2.678 | 0.2270 | 0.075 | 2.259 | 2.193 | 0.1278 | 0.715 | 0.3210 | 0.854 |
| SFA | ||||||||||||||
| C10:0 | 0.858 | 1.147 | 1.231 | 1.148 | 1.023 | 0.937 | 0.1068 | 0.091 | 1.029 | 1.086 | 0.0601 | 0.498 | 0.1511 | 0.329 |
| C16:0 | 19.338a | 17.951b,c | 17.316c | 17.864b,c | 17.437c | 18.890a,b | 0.4688 | 0.009 | 18.246 | 18.019 | 0.2639 | 0.544 | 0.6631 | 0.696 |
| C18:0 | 11.798c | 11.877c | 12.493b | 12.509b | 13.476a | 12.233b,c | 0.2129 | <0.001 | 12.435 | 12.361 | 0.1198 | 0.662 | 0.3011 | 0.504 |
| MUFA | ||||||||||||||
| C16:1 | 3.322a | 3.288a | 3.114a | 3.043a,b | 1.956c | 2.681b | 0.1502 | <0.001 | 2.802 | 2.999 | 0.0845 | 0.103 | 0.2124 | 0.168 |
| C17:1 | 1.670b | 2.137a | 1.992a | 2.034a | 0.544c | 0.789c | 0.1018 | <0.001 | 1.502 | 1.553 | 0.0573 | 0.526 | 0.1439 | 0.852 |
| C18:1n9t | 1.462c,d | 0.992d | 1.118c,d | 1.720c | 2.734b | 3.512a | 0.2589 | <0.001 | 1.866 | 1.980 | 0.1458 | 0.583 | 0.3662 | 0.079 |
| C18:1n9c | 34.824a | 32.462a,b | 32.701a | 32.465a,b | 26.237c | 29.981b | 1.0047 | <0.001 | 31.136 | 31.753 | 0.5655 | 0.442 | 1.4208 | 0.485 |
| C22:1 | 2.389d | 2.934b,c | 2.633c,d | 2.464c,d | 3.976a | 3.290b | 0.1783 | <0.001 | 2.993 | 2.902 | 0.1004 | 0.521 | 0.2522 | 0.358 |
| C24:1 | 0.290b | 0.120b | 0.141b | n.d.b | 1.656a | 1.809a | 0.1445 | <0.001 | 0.675 | 0.663 | 0.0813 | 0.917 | 0.2043 | 0.819 |
| PUFA | ||||||||||||||
| C18:2 | 8.883c | 9.577c | 9.742c | 9.413c | 22.795a | 17.598b | 0.9576 | <0.001 | 13.402 | 12.600 | 0.5390 | 0.295 | 1.3542 | 0.599 |
| C18:3n3 | 3.125b | 3.687b | 5.026a | 4.947a | 0.605c | 0.872c | 0.3076 | <0.001 | 2.983 | 3.104 | 0.1732 | 0.622 | 0.4350 | 0.387 |
| C20:3n6 | 1.798c | 2.160b,c | 2.131b,c | 1.984b,c | 2.723a | 2.242b | 0.1370 | <0.001 | 2.160 | 2.186 | 0.0771 | 0.816 | 0.1937 | 0.709 |
| C20:5 | 2.909b | 3.721a | 3.477a,b | 3.317a,b | 0.767c | 0.604c | 0.2298 | <0.001 | 2.469 | 2.463 | 0.1294 | 0.973 | 0.3250 | 0.198 |
| C22:5n3 | 4.047b | 4.774a | 4.238a,b | 4.107a,b | 2.036c | 1.721c | 0.2515 | <0.001 | 3.486 | 3.488 | 0.1416 | 0.990 | 0.3557 | 0.243 |
| C22:6 | 0.384b | 0.876a | 0.141b,c | 0.287b | n.d.c | n.d.c | 0.1026 | <0.001 | 0.309 | 0.254 | 0.0578 | 0.503 | 0.1451 | 0.518 |
Treatments include fodder beet high quality (FBH), fodder beet low quality (FBL), non–fodder beet high quality (NFBH), non–fodder beet low quality (NFBL), USDA Select (SEL), and USDA Top Choice (TC).
SEM: largest standard error of the least-squares means.
Values with unlike superscripts differ (P < 0.05).
MUFA = monounsaturated fatty acid; PL = polar lipid; PUFA = polyunsaturated fatty acid; SFA = saturated fatty acid.
Within the SFA, proportions of capric acid did not differ (P = 0.09) among treatments, but proportions of palmitic and stearic acids differed (P = 0.01 and P < 0.01, respectively). Palmitic acid made up a greater (P < 0.05) proportion of the PL fraction in FBH than in all treatments except Top Choice (P > 0.05). The proportion of palmitic acid was similar (P > 0.05) in Top Choice to FBL and NFBL but greater (P < 0.05) than in Select and NFBH. Contrastingly, Select had the greatest (P < 0.05) proportion of stearic acid. The proportion of stearic acid was similar in both NFB treatments (P > 0.05), and greater (P < 0.05) than both FB treatments, which were also similar to each other (P > 0.05). Proportions of stearic acid in Top Choice did not differ (P > 0.05) from the proportion found in any NZ treatments. The interactions of treatment and aging on the percentage of myristic acid and margaric acid found in the PL fraction are illustrated in Figures 4 and 5, respectively. No clear trend was evident in the proportions of myristic acid. An aging effect was present only within Select, in which samples had greater (P < 0.05) proportions of myristic acid after 35-d aging than after 21-d aging. Diet and quality treatments were otherwise similar (P > 0.05). Proportions of margaric acid were lower (P < 0.05) in Select samples aged 35 d than those aged 21 d, and Select aged 21 d had lower (P < 0.05) proportions of margaric acid than all other combinations of treatment and aging. Samples from Top Choice (regardless of aging) had lower (P < 0.05) proportions of margaric acid than FBL and NFBL aged 35 d; otherwise, proportions of margaric acid were similar (P > 0.05).
Interactions (P = 0.031) between finishing diet and aging on the percentage of C14:0 in the polar lipid fraction of fatty acids derived from the longissimus lumborum of steers finished on fodder beet or non-fodder beet forages (FB, NFB, respectively) and carcasses classified as high or low predicted eating quality based primarily on marbling in the longissimus muscle and ossification (H, L, respectively) or carcasses of USDA Select or Top Choice (SEL, TC, respectively) quality grades following aging under vacuum at 4°C for either 21 d or 35 d. Bars without common superscripts differ due to the interaction of diet and aging (P < 0.05). Largest standard error of the mean = 0.2400.
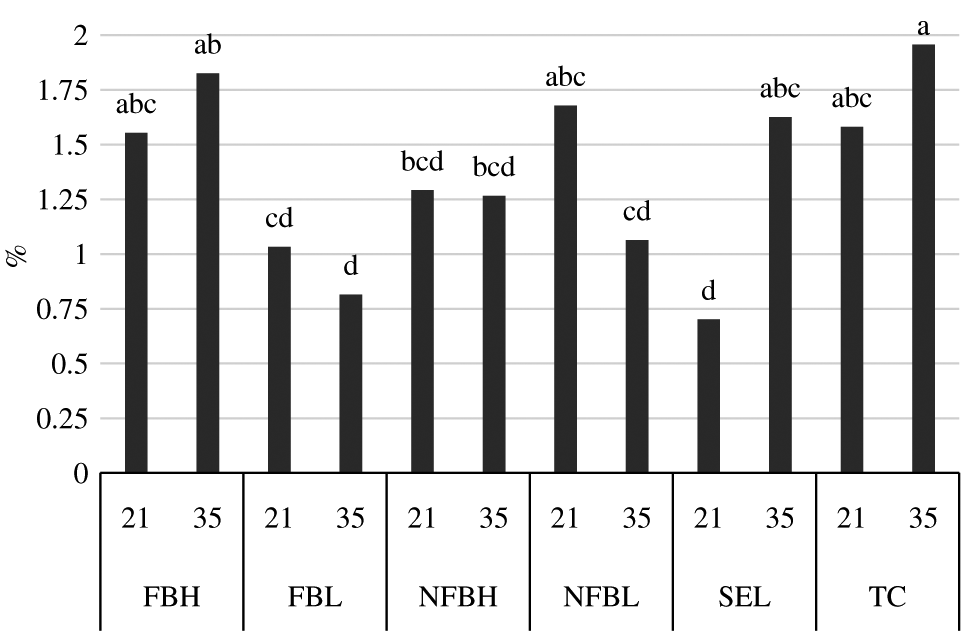
Interactions (P = 0.003) between finishing diet and aging on the percentage of C17:0 in the polar lipid fraction of fatty acids derived from the longissimus lumborum of steers finished on fodder beet or non-fodder beet forages (FB, NFB, respectively) and carcasses classified as high or low predicted eating quality based primarily on marbling in the longissimus muscle and ossification (H, L, respectively) or carcasses of USDA Select or Top Choice (SEL, TC, respectively) quality grades following aging under vacuum at 4°C for either 21 d or 35 d. Bars without common superscripts differ due to the interaction of diet and aging (P < 0.05). Largest standard error of the mean = 0.0905.
Within the MUFA of the PL fraction, differences were detected (P < 0.01) in all individual FA. Proportions of palmitoleic acid were similar (P > 0.05) among all FB and NFB treatments. Additionally, Top Choice had a lower (P < 0.05) proportion of palmitoleic acid than all NZ treatments except NFBL (P > 0.05). The proportion of palmitoleic acid was lowest (P < 0.05) in Select. The proportion of heptadecenoic acid was greatest (P < 0.05) in both NFB treatments and FBL; FBH had lower (P < 0.05) proportions of heptadecenoic acid than the other NZ treatments. Both US treatments had lower (P < 0.05) proportions of heptadecenoic acid than all other treatments. Proportions of elaidic acid were greatest (P < 0.05) in Top Choice and greater (P < 0.05) in Select than all NZ treatments. Within the NZ treatments, NFBL had a greater (P < 0.05) proportion of elaidic acid than FBL, and NFBH and FBH had similar (P > 0.05) proportions to both NFBL and FBL. Oleic acid, the most predominant FA of the MUFA, was present in greater (P < 0.05) proportions in FBH and NFBH than in Top Choice and Select; proportions in FBL and NFBL were similar (P > 0.05) to those in FBH and NFBH and to proportions in Top Choice. The proportions of oleic acid were lowest (P < 0.05) in Select. Contrastingly, erucic acid was present in the greatest (P < 0.05) proportions in Select and greater (P < 0.05) in Top Choice than in both NFB treatments and FBH. Proportions of erucic acid in FBL were similar (P > 0.05) to Top Choice and to both NFBH treatments but were greater (P < 0.05) than in FBH, which also had similar (P > 0.05) proportions to both NFB treatments. Finally, nervonic acid was greater (P < 0.05) in Select and Top Choice than in all other treatments.
Linoleic acid, which was the predominant PUFA, made up a greater (P < 0.05) proportion of the PL in both US treatments than in all other treatments. Additionally, Top Choice had a greater (P < 0.05) proportion of linoleic acid than Select. The proportion of α-linolenic acid was greater (P < 0.05) in both NFB treatments than both FB treatments and was greater (P < 0.05) in both FB treatments than both US treatments. Dihomo-γ-linolenic acid was present in the greatest (P < 0.05) proportion in Select. Samples from Top Choice had greater (P < 0.05) proportions of this FA than FBH, but all other treatments were similar (P > 0.05). The proportions of EPA and DPA followed similar trends and were both lowest (P < 0.05) in Select and Top Choice. Proportions were greater (P < 0.05) in FBL than in FBH, and both NFB treatments were similar (P > 0.05) and intermediate to FBL and FBH. The proportion of DHA was greater (P < 0.05) in FBL than all other treatments. Proportions of DHA in FBH and NFBL were greater (P < 0.05) than in Select and Top Choice, where it was not detected; however, NFBH had proportions of DHA low enough to be similar (P > 0.05) to the US treatments in which DHA was not detected.
Discussion
TFA
TFA present in all samples were greater than those reported by Bronkema et al. (2019) based on samples submitted for analyses as part of a survey of commercially available grass-fed beef in the US. While average TFA reported by Bronkema et al. (2019) were lesser than our findings, the range of FA reported was broad, with some samples having FA greater than even our grain-fed treatments. Additionally, carcass data were not reported, but it is possible that those animals had lesser total fat content than those in the present study. TFA of commercially available organic grass-fed beef reported by Chail et al. (2016) were similar to our findings for all grass-fed samples, though they reported greater values for USDA Choice grain-fed samples.
Based on marbling scores for the same carcasses reported by Garmyn et al. (2019), it was expected that NFBH would have had greater TFA than those reflected in these results, more similar to those of FBH and reflecting the expected variation in quality grade based on product selection. However, variation in carcass size and other measures of lipid indicate that, taken together, this result is not unlikely. Factors including body size and composition, maturity, genetics, and distribution of fat in the muscle can influence the TFA. Greater TFA in Top Choice is reasonable considering its elevated marbling scores (Garmyn et al., 2019). Within US and FB samples, the higher-quality treatment had greater TFA, likely related to increased intramuscular fat. While not statistically different, NFBH did have numerically greater TFA than NFBL. Other researchers have previously reported decreased total fats with lower–energy-density pasture-based diets (Leheska et al., 2008; Buchanan et al., 2013; Chail et al., 2016); however, selection according to quality in the present study mitigated a majority of this difference.
TFA in the present study are reported as the sum of the NL and PL fractions. The NL are composed primarily of triglycerides that are deposited in the adipose tissues during lipid filling as a result of surplus energy and, therefore, generally increase with quality grade and make up a majority of the total fat in a carcass (Wood et al., 2008). Contrastingly, the PL fraction consists primarily of phospholipids serving as structural components of cell membranes; therefore, they do not vary drastically regardless of fat level and generally make up a much smaller proportion of the TFA, especially in finished animals (Wood et al., 2008). Legako et al. (2015) thoroughly outlines this relationship. Because the TFA are largely composed of NL, the concentration of NL identically follows the relationship reflected in the TFA in the present study. A lack of difference in total PL among treatments also reflects this relationship. Others have reported similar trends (Duckett et al., 1993; Itoh et al., 1999).
Additionally, NL and PL fractions generally reflect different compositions of the major groups of FA. In a serial slaughter study investigating time on feed, Duckett et al. (1993) reported that NL consisted of 51% SFA, 47% MUFA, and 2% PUFA and PL consisted of 28% SFA, 30% MUFA, and 32% PUFA on average from all samples across all time points. Legako et al. (2015) reported that NL consisted of 47% SFA, 50% MUFA, and 3% PUFA and PL consisted of 47% SFA, 44% MUFA, and 9% PUFA in raw beef samples representing 3 USDA quality grades (Prime, Low Choice, and Select). Composition of these fractions in the present study are in between those reported by these researchers, with NL consisting of 43% SFA, 55% MUFA, and 2% PUFA and PL consisting of 34% SFA, 41% MUFA, and 24% PUFA on average across all treatments. While these data are not identical due to a variety of factors, which may include animal diet, animal maturity, hot carcass weight, and breed, among others, they do reflect an important trend that the PL fraction generally accounts for a larger proportion of PUFA than the NL fraction (Larick and Turner, 1990; Duckett et al., 1993; Wood et al., 2008; Legako et al., 2015).
NL
Within the NL fraction, decreased percentages of SFA in US treatments is reflected by increased percentages of MUFA in Top Choice and increased percentages of PUFA in both Top Choice and Select, though Select to a greater degree. Variation in the major lipid fractions indicate shifts in a few key individual FA as functions of diet and total lipid. As previously discussed, the PUFA make up a generally small proportion of the NL fraction and, consequently, a small proportion of beef fat overall. This is due largely to biohydrogenation of dietary FA that occurs in the rumen upon consumption (Wood et al., 2008). Contrary to the findings of the present study, it is generally reported that PUFA are increased in pasture-fed beef (Buchanan et al., 2013; Duckett et al., 2013; Van Elswyk and McNeill, 2014). Total percentage of PUFA is elevated in US treatments in the present study as a result of an increased proportion of linoleic acid compared to both NZ treatments. Additionally, increased percentages of PUFA in NFB compared to FB reflects greater proportions of α-linolenic acid in the prior. Decreased α-linolenic acid in both FB treatments compared to NFB treatments may indicate a difference in FA composition of the forages; however, that is beyond the scope of this study. A lesser proportion of the NL being composed of PUFA in all NZ treatments may also be a result of increased biohydrogenation of α-linolenic acid compared with linoleic acid. Doreau and Ferlay (1994) reported that α-linolenic acid is biohydrogenated to SFA and MUFA in the rumen to a greater degree than linoleic acid (85%–100% compared to 70%–95%). As discussed by Duckett et al. (1993), it is also possible that biohydrogenation is decreased as a result of decreased rumen pH from grain feeding, ultimately resulting in more unsaturated FA available for absorption in the small intestine. This may also contribute to the elevated percentages of SFA in the NZ treatments compared to the US treatments.
While variation in SFA is somewhat inconsistent in the literature (Daley et al., 2010), Van Elswyk and McNeill (2014) reported that US studies generally report increased SFA in grass-fed beef on a percentage basis. Differences in percentages of SFA were largely attributable to variation in palmitic and stearic acid, which were the predominant SFA in all samples. Although US grain-fed samples had decreased percentages of SFA, this decrease in Top Choice was largely a result of decreased stearic acid while this decrease in Select was more attributable to decreased palmitic acid. The decreased proportion of palmitic acid in Select is contrary to many reports of increased palmitic acid in which animals are exposed to grain due to increased de novo FA synthesis (Duckett et al., 2009; Wright et al., 2015; Chail et al., 2016); however, increased palmitic acid in Top Choice compared to Select and a general numerical trend of increased palmitic acid in high-quality samples from all diets indicates that the proportion of palmitic acid in beef fat may be a function of amount of fat in addition to differences in diet. It is also possible that this difference is more a consequence of shifts in composition of other FA than a true metabolic effect on palmitic acid. A decreased proportion of stearic acid in Top Choice, however, is not surprising. A review by Daley et al. (2010) outlines an increase in stearic acid in pasture-fed beef as a result of biohydrogenation of dietary PUFA. Others have reported similar findings (Leheska et al., 2008; Duckett et al., 2013). Additionally, Smith and Johnson (2016) describe a relationship of grain-based diets and increasing intramuscular fat with upregulation of stearoyl coenzyme A desaturase (SCD; Δ9-desaturase), which desaturates stearic acid to oleic acid, consequently decreasing the proportion of stearic acid and increasing the proportion of oleic acid and its isomers. The decreased degree of this relationship in Select despite grain feeding is likely a result of increased intramuscular fat in Top Choice compared to Select.
The percentage of MUFA in the NL fraction was elevated only in Top Choice compared to all other treatments. Others have traditionally reported increased percentages of MUFA in grain-fed beef compared to pasture-fed beef, again as a result of upregulation of SCD (Duckett et al., 2009; Daley et al., 2010; Smith et al., 2012; Wright et al., 2015). However, MUFA and activity of SCD have also been associated with increased total intramuscular fat (Smith and Johnson, 2016). Therefore, it is possible that increased percentage of MUFA in Top Choice compared to all other treatments is a function of both diet and increased fat. As expected, oleic acid was the predominant MUFA in all samples. Oleic acid is the predominant MUFA in beef fat (Wood et al., 2008). However, differences in percentage of MUFA in the present study are largely attributable to the previously discussed increase in elaidic acid. While only differing to a degree to significantly impact percentage of MUFA in Top Choice, the percentage of elaidic acid was increased in both Top Choice and Select compared to all other treatments.
PL
Within the PL fraction, both MUFA and PUFA—and the individual FA that compose them—were influenced by treatment. An increase in PUFA in Select was reflected by a proportional decrease in MUFA. Shifts in several individual FA contribute to these differences. Within the MUFA, decreases in the proportions of palmitoleic and oleic acids appear to contribute most to the shift to decreased overall MUFA, while linoleic and dihomo-γ-linolenic acids are elevated in the PUFA of Select. Decreased palmitoleic acid may be related to the similarly low levels of palmitic acid, its precursor, in Select. Hunt et al. (2016) similarly reported decreased palmitoleic acid in Select samples of the longissimus lumborum compared to Upper Two-Thirds Choice samples. Others have also proposed a relationship between intramuscular fat and individual FA in the PL fraction (Duckett et al., 1993; Itoh et al., 1999; Legako et al., 2015); however, this relationship does not appear to hold true within the pasture-finished NZ samples in the present study. Decreased oleic acid appears to correspond to an increase in stearic acid, indicating decreased activity of desaturase enzymes, possibly as a result of the leanness of Select samples. Increased lipid has been linked to upregulation of SCD, shifting stearic acid to oleic acid (Smith et al., 2012; Buchanan et al., 2013; Smith and Johnson, 2016).
The PUFA are generally associated with the PL fraction because ruminants conserve essential FA in the muscle, where they are important for cellular function, rather than storing them in adipose tissue, where they would be used for energy (Larick and Turner, 1990; Wood et al., 2008). Elevated linoleic acid in both US treatments is likely a result of increased linoleic acid provided by grain-based diets, and the increase in proportion of linoleic in Select compared to Top Choice may be a result of the leaner nature of Select compared to Top Choice, affecting the distribution of FA in the PL fraction. The PUFA are the most heavily impacted by diet (Wood et al., 2008). Grains generally provide greater concentrations of linoleic acid, whereas forages provide greater concentrations of linolenic acid (Wood et al., 2008; Schmidt et al., 2013; Scollan et al., 2014). Because these are essential FA and must be provided by the diet, their presence in tissue is a direct result of diet (Wood et al., 2008; Daley et al., 2010). It is also important to note that, although linoleic and α-linolenic acid were the only PUFA detected in the NL of these samples, 4 additional long-chain PUFA were detected in the PL fraction. According to Wood et al. (2008), this is not uncommon, and these long-chain PUFA are found almost exclusively in the PL fraction in beef. These FA are a result of elongation and desaturation of linoleic and α-linolenic acid provided by the diet. Those elevated in NZ treatments (EPA, DPA, and DHA) are products of α-linolenic acid and are associated with health benefits in humans (Daley et al., 2010; Scollan et al., 2014; Van Elswyk and McNeill, 2014). Dihomo-γ-linolenic acid, which is elevated in US treatments, is a product of linoleic acid. Many others have similarly reported increases in α-linolenic acid and the long-chain n-3 PUFA derived from it in grass-fed cattle (Wood and Enser, 1997; Wood et al., 2008; Daley et al., 2010; Van Elswyk and McNeill, 2014). Dietary contributions of linoleic and α-linolenic acid are, once again, reflected in the present study. However, decreased α-linolenic acid in FB samples compared to NFB samples indicates a different chemical makeup of FB compared to traditional grass forages. Several have described differences in the nutritional value of FB compared to traditional grass forages, though further characterization of the FA profile would better explain this result (Matthew et al., 2011; Gibbs and Saldias, 2014).
Postmortem aging
Aging had little impact in the present study. No differences in proportions of individual or groups of FA occurred due to aging. The PUFA are generally susceptible to oxidation over time due to the instability of the double bonds (Gray and Monahan, 1992). Therefore, it is not unreasonable to infer that shifts in the FA profile could occur during aging. Mahecha et al. (2009) reported that, when stored at ~1°C, PUFA decreased over a 14-d aging period. Therefore, it is possible that shifts in FA could occur in the present study when extending postmortem aging to 35 d from 21 d postmortem; however, Holman et al. (2019) reported no differences in PUFA when samples were aged under vacuum and refrigeration for up to 12 wk.
Conclusions
From the present study, it is evident that diet largely affects the composition of FA in the NL and PL fractions of beef. To a lesser extent, quality—and particularly intramuscular fat—also influences individual FA through metabolic regulation. FA content and composition directly influence flavor and texture of beef, and relationships have been described by many researchers, especially regarding differences in pasture-fed and grain-fed beef (Melton et al., 1982; Calkins and Hodgen, 2007; Wood et al., 2008; Hunt et al., 2016; O’Quinn et al., 2016). Similarly, the majority of differences outlined in the present study were between US grain-fed beef and both NZ treatments. It appears that grazing FB does not drastically affect the lipid profiles of beef compared with beef from cattle that grazed traditional grass forages in NZ when product is selected based on quality descriptors. According to Garmyn et al. (2019), consumers did not differentiate between FB and NFB treatments, regardless of high or low eating quality, for tenderness, juiciness, flavor liking, or overall liking when meat was aged 35 d. Limited eating quality variation existed when samples were aged 21 d, but in those instances, consumers favored FB over NFB samples. Therefore, taking results for lipid profiles together with the sensory results described by Garmyn et al. (2019), FB could reasonably be substituted for grass forages to sustain the NZ beef industry through winter months and limit seasonality without detrimental effects on product quality.
Literature Cited
Beef and Lamb New Zealand. 2012. Energy requirements of cattle. Beef and Lamb New Zealand, Wellington. https://beeflambnz.com/knowledge-hub/PDF/energy-requirements-cattle. (Accessed 1 February 2020).
Beef and Lamb New Zealand. 2017. Guide to New Zealand cattle farming. K. Geenty, and S. Morris, editors. Beef and Lamb New Zealand, Wellington. https://beeflambnz.com/knowledge-hub/PDF/guide-new-zealand-cattle-farming. (Accessed 1 February 2020).
Bligh, E. G., and W. J. Dyer. 1959. A rapid method of total lipid extraction and purification. Can. J. Biochem. Physiol. 37:911–917. https://doi.org/10.1139/y59-099.
Bronkema, S. M., J. E. Rowntree, R. Jain, J. P. Schweihofer, C. A. Bitler, and J. I. Fenton. 2019. A nutritional survey of commercially available grass-finished beef. Meat and Muscle Biology. 3:116. https://doi.org/10.22175/mmb2018.10.0034.
Buchanan, J., A. Garmyn, G. Hilton, D. VanOverbeke, Q. Duan, D. Beitz, and R. Mateescu. 2013. Comparison of gene expression and fatty acid profiles in concentrate and forage finished beef. J. Anim. Sci. 91:1–9. https://doi.org/10.2527/jas2012-5154.
Calkins, C. R., and J. M. Hodgen. 2007. A fresh look at meat flavor. Meat Sci. 77:63–80. https://doi.org/10.1016/j.meatsci.2007.04.016.
Chail, A., J. F. Legako, L. R. Pitcher, T. C. Griggs, R. E. Ward, S. Martini, and J. W. MacAdam. 2016. Legume finishing provides beef with positive human dietary fatty acid ratios and consumer preference comparable with grain-finished beef. J. Anim. Sci. 94:2184–2197. https://doi.org/10.2527/jas2015-0241.
Charteris, P. L., S. T. Morris, and P. N. P. Matthews. 2000. Pasture-based beef production in New Zealand. http://citeseerx.ist.psu.edu/viewdoc/download?doi=10.1.1.585.2891&rep=rep1&type=pdf (Accessed 1 February 2020).
Christie, W. W., editor. 1993. Advances in lipid methodology. Volume 2. Oily Press Lipid Library Series, Dundee, Scotland.
Daley, C. A., A. Abbott, P. S. Doyle, G. A. Nader, and S. Larson. 2010. A review of fatty acid profiles and antioxidant content in grass-fed and grain-fed beef. Nutr. J. 9:1–12. https://doi.org/10.1186/1475-2891-9-10.
Doreau, M., and A. Ferlay. 1994. Digestion and utilisation of fatty acids by ruminants. Anim. Feed Sci. Technol. 45:379–396. https://doi.org/10.1016/0377-8401(94)90039-6.
Duckett, S. K., J. P. S. Neel, J. P. Fontenot, and W. M. Clapham. 2009. Effects of winter stocker growth rate and finishing system on: III. Tissue proximate, fatty acid, vitamin, and cholesterol content. J. Anim. Sci. 87:2961–2970. https://doi.org/10.2527/jas.2009-1850.
Duckett, S. K., J. P. S. Neel, R. M. Lewis, J. P. Fontenot, and W. M. Clapham. 2013. Effects of forage species or concentrate finishing on animal performance, carcass and meat quality. J. Anim. Sci. 91:1454–1467. https://doi.org/10.2527/jas2012-5914.
Duckett, S. K., D. G. Wagner, L. D. Yates, H. G. Dolezal, and S. G. May. 1993. Effects of time on feed on beef nutrient composition. J. Anim. Sci. 71:2079–2088. https://doi.org/10.2527/1993.7182079x.
Folch, J., M. Lees, and G. H. Sloane Stanley. 1957. A simple method for the isolation and purification of total lipids from animal tissues. J. Biol. Chem. 226:497–509.
French, P., E. O’Riordan, F. Monahan, P. Caffrey, M. Vidal, M. Mooney, D. Troy, and A. Moloney. 2000. Meat quality of steers finished on autumn grass, grass silage or concentrate-based diets. Meat Sci. 56:173–180. https://doi.org/10.1016/S0309-1740(00)00037-1.
Garmyn, A. J., R. J. Polkinghorne, J. C. Brooks, and M. F. Miller. 2019. Consumer assessment of New Zealand forage finished beef compared to US grain fed beef. Meat and Muscle Biology. 3:22–32. https://doi.org/10.22175/mmb2018.10.0029.
Gibbs, J., and B. Saldias. 2014. Feeding fodder beet in New Zealand beef and sheep production. Proceedings of the Society of Sheep and Beef Cattle Veterinarians of the New Zealand Veterinary Association Annual Seminar, Hamilton, New Zealand. 16–20 June 2014. p. 83–90.
Gray, J. I., and F. J. Monahan. 1992. Measurement of lipid oxidation in meat and meat products. Trends Food Sci. Technol. 3:315–319. https://doi.org/10.1016/S0924-2244(10)80019-6.
Hodgson, J., K. Cameron, D. Clark, L. Condron, T. Fraser, M. Hedley, C. Holmes, P. Kemp, R. Lucas, D. Moot, S. Morris, P. Nicholas, N. Shadbolt, G. Sheath, I. Valentine, G. Waghorn, and D. Woodfield. 2005. New Zealand’s pastoral industries: Efficient use of grassland resources. In: S. G. Reynolds, and J. Farme, editors, Grasslands, developments, opportunities, perspectives. Science Publication, New Hampshire, USA. p. 181–205.
Holman, B. W. B., K. L. Bailes, M. J. Kerr, and D. L. Hopkins. 2019. Point of purchase fatty acid profile, oxidative status and quality of vacuum-packaged grass fed Australian beef held chilled for up to 12 weeks. Meat Sci. 158:107878. https://doi.org/10.1016/j.meatsci.2019.107878.
Hunt, M. R., J. F. Legako, T. T. N. Dinh, A. J. Garmyn, T. G. O’Quinn, C. H. Corbin, R. J. Rathmann, J. C. Brooks, and M. F. Miller. 2016. Assessment of volatile compounds, neutral and polar lipid fatty acids of four beef muscles from USDA Choice and Select graded carcasses and their relationships with consumer palatability scores and intramuscular fat content. Meat Sci. 116:91–101. https://doi.org/10.1016/j.meatsci.2016.02.010.
Itoh, M., C. B. Johnson, G. P. Cosgrove, P. D. Muir, and R. W. Purchas. 1999. Intramuscular fatty acid composition of neutral and polar lipids for heavy-weight Angus and Simmental steers finished on pasture or grain. J. Sci. Food Agr. 79:821–827. whttps://doi.org/10.1002/(SICI)1097-0010(19990501)79:6<821::AID-JSFA291>3.0.CO;2-N.
Kemp, P., P. Kenyon, and S. Morris. 2010. The use of legume and herb forage species to create high performance pastures for sheep and cattle grazing systems. Rev. Bras. Zootec. 39:169–174. https://doi.org/10.1590/S1516-35982010001300019.
Larick, D. K., and B. E. Turner. 1990. Flavor characteristics of forage- and grain-fed beef as influenced by phospholipid and fatty acid compositional differences. J. Food Sci. 55:312–317. https://doi.org/10.1111/j.1365-2621.1990.tb06751.x.
Legako, J. F., T. T. N. Dinh, M. F. Miller, and J. C. Brooks. 2015. Effects of USDA beef quality grade and cooking on fatty acid composition of neutral and polar lipid fractions. Meat Sci. 100:246–255. https://doi.org/10.1016/j.meatsci.2014.10.013.
Leheska, J. M., L. D. Thompson, J. C. Howe, E. Hentges, J. Boyce, J. C. Brooks, B. Shriver, L. Hoover, and M. F. Miller. 2008. Effects of conventional and grass-feeding systems on the nutrient composition of beef. J. Anim. Sci. 86:3575–3585. https://doi.org/10.2527/jas.2007-0565.
Macfarlane, M. J., B. C. Thomson, E. Crofoot, G. Hamilton, H. Ashby, and P. D. Muir. 2014. Evaluating new forage systems for East Coast dryland. Proceedings of the New Zealand Society of Animal Production. 74:108–114.
Mahecha, L., K. Nuernberg, G. Nuernberg, K. Ender, E. Hagemann, and D. Dannenberger. 2009. Effects of diet and storage on fatty acid profile, micronutrients and quality of muscle from German Simmental bulls. Meat Sci. 82:365–371. https://doi.org/10.1016/j.meatsci.2009.02.005.
Matthew, C., N. Nelson, D. Ferguson, and Y. Xie. 2011. Fodder beet revisited. Agron. New Zeal. 41:39–48.
Melton, S. L., M. Amiri, G. W. Davis, and W. R. Backus. 1982. Flavor and chemical characteristics of ground beef from grass-, forage-grain- and grain-finished steers. J. Anim. Sci. 55:77–87. https://doi.org/10.2134/jas1982.55177x.
O’Quinn, T. G., D. R. Woerner, T. E. Engle, P. L. Chapman, J. F. Legako, J. C. Brooks, K. E. Belk, and J. D. Tatum. 2016. Identifying consumer preferences for specific beef flavor characteristics in relation to cattle production and postmortem processing parameters. Meat Sci. 112:90–102. https://doi.org/10.1016/j.meatsci.2015.11.001.
Samuelson, K. L., M. E. Hubbert, M. L. Galyean, and C. A. Löest. 2016. Nutritional recommendations of feedlot consulting nutritionists: The 2015 New Mexico State and Texas Tech University survey. J. Anim. Sci. 94:2648–2663. https://doi.org/10.2527/jas2016-0282.
Schmidt, J. R., M. C. Miller, J. G. Andrae, S. E. Ellis, and S. K. Duckett. 2013. Effect of summer forage species grazed during finishing on animal performance, carcass quality, and meat quality. J. Anim. Sci. 91:4451–4461. https://doi.org/10.2527/jas2012-5405.
Scollan, N. D., D. Dannenberger, K. Nuernberg, I. Richardson, S. MacKintosh, J. F. Hocquette, and A. P. Moloney. 2014. Enhancing the nutritional and health value of beef lipids and their relationship with meat quality. Meat Sci. 97:384–394. https://doi.org/10.1016/j.meatsci.2014.02.015.
Smith, S. B., G. W. Go, B. J. Johnson, K. Y. Chung, S. H. Choi, J. E. Sawyer, D. T. Silvey, L. A. Gilmore, G. Ghahramany, and K. H. Kim. 2012. Adipogenic gene expression and fatty acid composition in subcutaneous adipose tissue depots of angus steers between 9 and 16 months of age. J. Anim. Sci. 90:2505–2514. https://doi.org/10.2527/jas.2011-4602.
Smith, S. B., and B. J. Johnson. 2016. Marbling: Management of cattle to maximize the deposition of intramuscular adipose tissue. J. Anim. Sci. 94:1–14. https://doi.org/10.2527/jam2016-0794.
USDA. 1997. United States standards for grades of carcass beef. Livest. Seed Program, Agric. Market. Serv, Washington, DC.
Van Elswyk, M. E., and S. H. McNeill. 2014. Impact of grass/forage feeding versus grain finishing on beef nutrients and sensory quality: The U.S. experience. Meat Sci. 96:535–540. https://doi.org/10.1016/j.meatsci.2013.08.010.
Watson, R., A. Gee, R. Polkinghorne, and M. Porter. 2008. Consumer assessment of eating quality - Development of protocols for Meat Standards Australia (MSA) testing. Aust. J. Exp. Agr. 48:1360–1367. https://doi.org/10.1071/EA07176.
Wood, J. D., and M. Enser. 1997. Factors influencing fatty acids in meat and the role of antioxidants in improving meat quality. Br. J. Nutr. 78:S49. https://doi.org/10.1079/BJN19970134.
Wood, J. D., M. Enser, A. V. Fisher, G. R. Nute, P. R. Sheard, R. I. Richardson, S. I. Hughes, and F. M. Whittington. 2008. Fat deposition, fatty acid composition and meat quality: A review. Meat Sci. 78:343–358. https://doi.org/10.1016/j.meatsci.2007.07.019.
Wright, A. M., J. G. Andrae, C. F. Rosso, M. C. Miller, E. Pavan, W. Bridges, and S. K. Duckett. 2015. Effect of forage type with or without corn supplementation on animal performance, beef fatty acid composition, and palatability. J. Anim. Sci. 93:5047–5058. https://doi.org/10.2527/jas.2015-8939.