
Introduction
According to the United States Meat Export Federation (USMEF), in 2019, 14.1% of US beef was exported, contributing over $7.4 billion of revenue, averaging $308.74 per head. The Republic of Korea (South Korea) was identified to be the US beef industry’s largest growing export market due to growing household incomes and insufficient beef production (USDA FAS, 2020; USMEF, 2020, 2021).
Currently, it takes a minimum of 28 d to ship chilled beef from the US to South Korea (USMEF, 2020). Colle et al. (2015, 2016) determined extended aging can cause product quality issues, such as increased lipid oxidation, darkened lean color (L*), and reduced redness (a*) throughout retail display. Extended aging also has been shown to decrease metmyoglobin-reducing activity (MRA) and pH (English et al., 2016) as well as mitochondrial oxygen consumption (OC) rate (Mancini and Ramanathan, 2014). Additionally, Gill (1996) suggested that when bone-in beef cuts stored or aged for a longer period of time are cut for retail display, the bone blackens faster than unaged bones. Further, the lean tissue of a short rib steak and much of the chuck roll steak contains the Serratus ventralis (SV) muscle, which has been classified as having low color stability (McKenna et al., 2005).
A potential solution to improve US beef shelf life is the application of antioxidants to the surface of the steaks. Antioxidants are commonly incorporated into ground products to improve color and delay lipid oxidation (Oswell et al., 2018). Ascorbic acid and rosemary extract have the potential to improve color stability of beef muscles (Djenane et al., 2003; Colle et al., 2019). Acerola cherry powder is a natural form of ascorbic acid. Determining a method to improve the color stability of US beef in international markets requiring lengthy shipping could provide the opportunity for increased international demand for US beef exports and producer profits. The objective of this study was to determine the effect of the topical application of acerola cherry powder and rosemary extract from various suppliers on beef bone-in short rib steak and chuck roll steak shelf life including color and lipid oxidation.
Materials and Methods
Product preparation
Eighteen beef bone-in short ribs (IMPS 123A) and 8 beef chuck rolls (IMPS 116A) from USDA Choice carcasses were purchased from a commercial harvest facility and transported to the University of Idaho Meat Laboratory under refrigeration (3.5 h; 4°C) on day 1 and day 2 postfabrication for the chuck rolls and short ribs, respectively. The subprimals were wet-aged at 0°C for 28 d postfabrication to simulate transpacific shipping time prior to being prepared for retail display. Following aging, short ribs, perpendicular to the bone, and chuck rolls were cut into 1.02-cm-thick steaks (N = 126) to mimic South Korean retail steak fabrication style. To avoid potential effects due to steak location within subprimal, steaks were assigned on a rotating basis to a treatment group (n = 16 steaks per treatment). Antioxidant treatments were topically sprayed (2 mL) with a commercially available spray bottle (CleanCheck Commercial Sprayer, Tolco, Toledo, OH). Volume sprayed was evaluated to consistently spray 1 g or 1 mL water prior to antioxidant application. Treatments based on previous research (Djenane et al., 2003; Colle et al., 2019) and manufacture recommendations included an untreated control (C), a 0.05% acerola cherry powder solution from 1 of 3 commercially available suppliers [C1 (Fortium A, Kemin Industries, Des Moines, IA), C2 (Micro Ingredients Acerola Cherries Organic Vitamin C Powder, Montclair, CA), or C3 (Acerola Cherry Powder, Pure, American Fork, UT)], or a 0.10% rosemary extract solution from 1 of 3 commercially available suppliers [R1 (Fortium R10 Dry, Kemin Industries), R2 (Herbalox Rosemary Extract, Kalsec, Kalamazoo, MI), or R3 (GUARDIAN Rosemary Extract 08, Danisco, Madison, WI)]. Half of the steaks were assigned by steak location within subprimal to day 0 lipid oxidation, MRA, and OC rate; the remaining steaks were assigned to 4 d of retail display followed by day 4 lipid oxidation and MRA. Steaks were displayed in a retail display room (366 cm in length × 274 cm in width × 274 cm in height) at 2°C. The display room was equipped with natural white 4,000 W lights, and the average light intensity at the steak surface was 849 lux (Fisherbrand Traceable Dual-Range Light Meter, Fisher Scientific, Waltham, MA). To avoid potential effects due to display location, steaks were rotated in the retail environment daily.
Retail fluid loss
Following topical application on day 0, retail display steaks were weighed, placed in white foam trays (CKF Inc. #88142, Langley, BC, Canada), and overwrapped with an oxygen-permeable polyvinyl chloride film (oxygen transmission rate: 1,450 cc/645 cm2 per 24 h; water vapor transmission rate: 17.0 g/645 cm2 per 24 h; Koch Industries, Inc., #7500-3815, Wichita, KS). Following 4 d of retail display, steaks were removed from the retail packaging and reweighed to determine retail moisture loss. Percent retail fluid loss was calculated using the following equation:
Retail color
Retail display steaks were allowed to bloom for 60 min, and then 2 objective color measurements per steak were obtained on the SV using a Nix Pro 2 Color Sensor (Nix Sensor Ltd., Hamilton, ON, Canada). Two objective color measurements were also taken on the bone marrow of the short rib steaks. The Nix Pro 2 Sensor was equipped with a 14-mm-diameter measuring area and a 2° standard observer. The instrument was set to Illuminant D65 and Commission Internationale de l´Eclairage L* (lightness), a* (redness), and b* (yellowness) values were recorded. After the initial reading on day 0 of retail display, color was measured a second time 6 h later. Subsequent color measurements were taken twice daily (06:00 and 18:00) on day 1, 2, and 3 and once (06:00) on day 4. Oxygenated lean color (1 = extremely bright cherry red, 8 = extremely dark red), discoloration (1 = none, 5 = extreme), surface discoloration (1 = no discoloration 0%, 6 = extensive discoloration 81% to 100%), bone marrow color (1 = bright reddish pink to red, 7 = black), color uniformity (1 = uniform no two-toning, 5 = extreme two-toning), and amount of browning (1 = no evidence of browning, 6 = dark brown) were evaluated at the time points previously described by a trained panel (4 evaluators for short rib steaks, 6 evaluators for chuck roll steaks) following American Meat Science Association guidelines (AMSA, 2012). Panelists were screened to check for color blindness and to fall within the age range of 14 to 59 years. Following screening, a training utilized pictures, color tiles, and in-person steak examples to standardize panelists.
Metmyoglobin-reducing activity
Nitric oxide MRA was measured after treatment on day 0 and on day 4 of retail display on the SV following protocols outlined in Section XI of the Meat Color Measurement Guidelines (AMSA, 2012). Two color measurements from each sample were obtained using a HunterLab MiniScan EZ (Reston, VA) equipped with a 25-mm-diameter measuring area and a 10° standard observer. The instrument was set to Illuminant A and reflectance from 400 to 700 nm was recorded. Calibration occurred by measuring against black and white calibration tiles prior to measuring color. The percentage of metmyoglobin (MMb) was calculated following equations in Section XI of the Meat Color Measurements Guidelines (AMSA, 2012). MRA was calculated as follows:
Oxygen consumption
OC was measured on the SV after treatment on day 0 following protocols outlined in the Meat Color Measurement Guidelines (AMSA, 2012). Color measurements were taken similar to the MRA protocol. The percentage of oxymyoglobin (OMb) was calculated following equations in Section XI of the Meat Color Measurement Guidelines (AMSA, 2012). OC was calculated as follows:
Lipid oxidation
Thiobarbituric acid reactive substances (TBARS) were analyzed in duplicate on day 0 after treatment and on day 4 of retail display following the protocol in Section XI, Appendix O of the Meat Color Measurement Guidelines (AMSA, 2012). Samples were excised from the SV avoiding the steak edge and large pieces of fat and connective tissue and weighed 1 g.
Statistical analysis
In this factorial design, there were 6 antioxidant treatments and 1 control treatment. Analyses collected at more than time point are a split-plot design with repeated measures. On the short ribs, data were collected on 18 subprimals and 63 steaks per antioxidant treatment-retail display time combination. On the chuck rolls, data were collected on 8 subprimals and 63 steaks per antioxidant treatment-retail display time combination. Data were analyzed using mixed model analysis of variance. Antioxidant treatments, retail display time, and their interaction were assumed as fixed effects. Retail display time was considered a repeated measure modeled as a compound symmetric correlation structure. MRA and lipid oxidation were evaluated at 2 retail display time points, whereas color was analyzed at 9 retail display time points. Each steak subjective color score was averaged across evaluators prior to analysis. Subjective and objective color data were analyzed with subprimal and steak location within subprimal as random effects. Treatment least square means differences were assessed through pair-wise comparisons for significant effects. Significance was determined at P < 0.05. All statistical analyses were conducted using SAS V 9.4 (SAS Inc., Cary, NC).
RESULTS AND DISCUSSION
Retail fluid loss
In the short rib steaks, there was a significant difference in retail fluid loss between the treatments (P = 0.024; Table 1). The control and R1 treated steaks lost the most fluid loss over retail display. The remaining antioxidant treatments (C1, C2, C3, R2, and R3) all had decreased fluid loss (P < 0.05) compared to the control steaks. Loss of fluid during retail display results in a drier cooked product for the consumer (Lawrie and Ledward, 2006). One hypothesis for the reduced retail fluid loss in antioxidant-treated steaks is that the antioxidants formed hydrogen bonds with water and meat proteins, thus reducing purge compared to the control. Research connecting retail fluid loss to antioxidant treatment is scarce. Therefore, more research is needed to determine the relationship between topical antioxidant treatments and retail fluid loss. Future research utilizing a positive control treatment of 2 mL water topically applied to steaks could assist in determining the relationship.
Estimated mean effects of topical antioxidant treatment on bone-in short rib steak fluid loss, color, oxygen consumption, and lipid oxidation (n = 63)
| Topical antioxidant treatment1 | |||||||||
|---|---|---|---|---|---|---|---|---|---|
| Trait | Control | C1 | C2 | C3 | R1 | R2 | R3 | SEM | P value |
| Retail fluid loss, % | 3.35a | 0.62b | 0.40b | 0.15b | 1.54ab | 0.52b | 0.61b | 0.80 | 0.024 |
| Bone marrow L* | 45.39abc | 46.28a | 45.21bcd | 44.75cd | 46.13ab | 46.08ab | 44.11d | 0.92 | 0.001 |
| Bone marrow a* | 14.54b | 14.20b | 14.76b | 14.07b | 14.16b | 14.30b | 15.52a | 0.37 | 0.001 |
| Bone marrow b* | 10.00c | 10.57bc | 10.56bc | 10.57bc | 10.69b | 10.75b | 11.35a | 0.25 | 0.004 |
| Lean L* | 41.11 | 41.22 | 41.06 | 42.08 | 41.22 | 40.68 | 40.90 | 0.68 | 0.445 |
| Lean a* | 20.49 | 21.47 | 21.36 | 21.11 | 20.49 | 20.83 | 21.10 | 0.38 | 0.412 |
| Lean b* | 13.17 | 13.90 | 13.88 | 13.41 | 13.60 | 13.68 | 13.80 | 0.41 | 0.855 |
| Oxygenated lean color2 | 4.5a | 4.2c | 4.3b | 4.3b | 4.3b | 4.2bc | 4.2bc | 0.2 | 0.001 |
| Amount of browning3 | 1.1 | 1.1 | 1.1 | 1.1 | 1.1 | 1.1 | 1.1 | 0.1 | 0.202 |
| Discoloration4 | 1.1 | 1.1 | 1.1 | 1.1 | 1.1 | 1.1 | 1.1 | 0.1 | 0.262 |
| Surface discoloration5 | 1.1 | 1.1 | 1.1 | 1.1 | 1.1 | 1.1 | 1.1 | 0.1 | 0.491 |
| Color uniformity6 | 1.3 | 1.3 | 1.3 | 1.3 | 1.4 | 1.4 | 1.3 | 0.1 | 0.307 |
| Bone marrow color7 | 3.4 | 3.3 | 3.4 | 3.5 | 3.4 | 3.3 | 3.3 | 0.1 | 0.235 |
| Oxygen consumption, % | 48.78 | 55.64 | 52.16 | 43.49 | 58.04 | 55.74 | 60.68 | 6.00 | 0.224 |
| Lipid oxidation8 | 0.50 | 0.53 | 0.51 | 0.47 | 0.42 | 0.48 | 0.35 | 0.07 | 0.323 |
Within a row, means without a common superscript differ (P < 0.05).
Treatments included an untreated control (C), topically sprayed (2 mL) with a 0.05% acerola cherry powder solution from 1 of 3 suppliers (C1, C2, or C3), or topically sprayed (2 mL) with a 0.10% rosemary extract solution from 1 of 3 suppliers (R1, R2, or R3).
Oxygenated lean color scale: 1 = extremely bright cherry red, 8 = extremely dark red.
Amount of browning scale: 1 = no evidence of browning, 6 = dark brown.
Discoloration scale: 1 = none, 5 = extreme.
Surface discoloration scale: 1 = no discoloration (0%), 6 = extensive discoloration (81% to 100%).
Color uniformity scale: 1 = uniform no two-toning, 5 = extreme two-toning.
Bone marrow color scale: 1 = bright reddish pink to red, 7 = black.
Milligrams malondialdehyde/kilograms meat.
SEM = standard error of the mean.
In the chuck roll steaks, antioxidants did not impact fluid loss in the steaks throughout retail display (Table 2; P = 0.372), similar to Colle et al. (2019). The overall average retail display fluid loss was 2.21%, which is slightly higher than steaks from Longissimus lumborum, Gluteus medius, Biceps femoris, and Semimembranosus aged for an extended period of time observed in previous studies (Colle et al., 2015, 2016, 2019). Additionally, this was higher than the average (1.03%) for the bone-in short ribs in the current study. Chuck roll steaks are composed of several muscles which may lead to greater fluid loss and increased variation. Lastly, cutting the steaks thinner (1.02 cm) than traditional fabrication (2.54 cm) may have increased fluid loss, as greater surface area has been associated with increased fluid loss (Aberle et al., 2012).
Estimated mean effects of topical antioxidant treatment on chuck roll steak fluid loss, color, oxygen consumption, and lipid oxidation (n = 63)
| Topical antioxidant treatment1 | |||||||||
|---|---|---|---|---|---|---|---|---|---|
| Trait | Control | C1 | C2 | C3 | R1 | R2 | R3 | SEM | P value |
| Retail fluid loss, % | 1.00 | 1.55 | 4.72 | 1.23 | 1.52 | 3.99 | 1.28 | 1.50 | 0.372 |
| L* | 39.20ab | 38.87bc | 38.90bc | 38.41c | 39.95a | 39.79a | 38.86bc | 0.98 | 0.001 |
| b* | 13.57 | 14.05 | 13.77 | 14.11 | 14.23 | 14.25 | 13.89 | 0.30 | 0.186 |
| Oxygenated lean color2 | 5.3 | 5.3 | 5.3 | 5.4 | 5.1 | 5.2 | 5.3 | 0.2 | 0.373 |
| Amount of browning3 | 2.7 | 2.7 | 2.7 | 2.8 | 2.7 | 2.6 | 2.6 | 0.1 | 0.801 |
| Discoloration4 | 2.6 | 2.5 | 2.6 | 2.6 | 2.5 | 2.6 | 2.5 | 0.1 | 0.924 |
| Surface discoloration5 | 2.8 | 2.7 | 2.7 | 2.9 | 2.7 | 2.8 | 2.7 | 0.1 | 0.584 |
| Color uniformity6 | 2.7 | 2.7 | 2.6 | 2.7 | 2.7 | 2.6 | 2.7 | 0.1 | 0.552 |
| Oxygen consumption, % | 63.30 | 67.93 | 58.33 | 66.17 | 65.12 | 66.79 | 61.62 | 4.00 | 0.053 |
| Lipid oxidation7 | 0.71 | 0.65 | 0.61 | 0.69 | 0.68 | 0.70 | 0.54 | 0.08 | 0.276 |
Within a row, means without a common superscript differ (P < 0.05).
Treatments included an untreated control (C), topically sprayed (2 mL) with a 0.05% acerola cherry powder solution from 1 of 3 suppliers (C1, C2, or C3), or topically sprayed (2 mL) with a 0.10% rosemary extract solution from 1 of 3 suppliers (R1, R2, or R3).
Oxygenated lean color scale: 1 = extremely bright cherry red, 8 = extremely dark red.
Amount of browning scale: 1 = no evidence of browning, 6 = dark brown.
Discoloration scale: 1 = none, 5 = extreme.
Surface discoloration scale: 1 = no discoloration (0%), 6 = extensive discoloration (81% to 100%).
Color uniformity scale: 1 = uniform no two-toning, 5 = extreme two-toning.
Milligrams malondialdehyde/kilograms meat.
SEM = standard error of the mean.
Retail objective color
An interaction between retail display time and treatment was not observed in short rib steak bone marrow L*, a*, or b* (P = 0.936, P = 0.246, and P = 0.277, respectively). However, antioxidant treatments differed in L*, a*, and b* (P < 0.001, P = 0.001, P = 0.004, respectively; Table 1) for short rib steak bone marrow. Interestingly, steaks treated with R3 had darker and redder bone marrow (P < 0.05) than the control steaks. Additionally, all rosemary extract–treated steaks (R1, R2, and R3) had more yellow bone marrow (P <0.05) than the control steaks. Ascorbic acid, the active ingredient of acerola cherry powder, has the ability to donate electrons to prevent the myoglobin oxidation process (Buettner and Jerkiewicz, 1996), which is similar to hemoglobin oxidation (Lanari et al., 1995). Based on previous research of ascorbic acid on vertebrae (Mancini et al., 2004), it was anticipated that acerola cherry powder would improve redness more than rosemary extract–treated bone marrow and untreated bone marrow (C). However, differences in bone marrow redness between treatments did not occur possibly due to the lower concentrations of acerola cherry powder used compared to research by Mancini et al. (2004), who used higher concentrations of ascorbic acid. Lower concentrations of ascorbic acid act as a meat pro-oxidant by reducing iron from the ferric to ferrous state, a powerful pro-oxidant (Buettner and Jerkiewicz, 1996). Utilizing higher acerola cherry powder concentrations in future research could improve redness. Throughout retail display, bone marrow differed in L*, a*, and b* (P =0.020, P < 0.001, P < 0.001, respectively; Table 3). Lightness of the bone marrow fluctuated throughout retail display, whereas redness and yellowness decreased over time. The decline in bone marrow color after being exposed to oxygen was anticipated due to the oxidation of iron within the hemoglobin (Gill, 1996; Lanari et al., 1995).
Estimated mean effects of retail display time on bone-in short rib steak color (n = 63)
| Time of retail display (hours) | |||||||||||
|---|---|---|---|---|---|---|---|---|---|---|---|
| Trait | 1 | 7 | 19 | 31 | 43 | 55 | 67 | 79 | 91 | SEM | P value |
| Bone marrow L* | 46.11ab | 45.56abcd | 44.83cd | 45.16bcd | 45.67abc | 46.52a | 45.25bcd | 45.23bcd | 44.45d | 0.92 | 0.001 |
| Bone marrow a* | 20.01a | 17.01b | 13.52cde | 14.18c | 13.64cd | 13.21def | 12.75f | 13.46cdef | 12.79ef | 0.38 | 0.001 |
| Bone marrow b* | 14.06a | 11.46b | 10.56c | 9.51d | 9.96cd | 10.00cd | 9.53d | 10.60c | 10.10cd | 0.27 | 0.001 |
| Lean L* | 39.79cd | 39.46d | 40.55bc | 40.89b | 43.03a | 41.14b | 41.06b | 43.34a | 41.39b | 0.64 | 0.001 |
| Lean a* | 21.77a | 20.47c | 22.00a | 21.56ab | 20.85bc | 20.68c | 20.78bc | 20.18c | 20.52c | 0.34 | 0.001 |
| Lean b* | 15.25a | 11.59f | 14.89ab | 13.12de | 14.37bc | 12.81e | 13.77cd | 14.27bc | 12.62e | 0.33 | 0.001 |
| Oxygenated lean color1 | 3.5f | 3.7e | 4.0d | 4.1d | 4.4c | 4.6c | 4.7b | 4.9a | 5.0a | 0.2 | 0.001 |
| Amount of browning2 | 1.0c | 1.0c | 1.0c | 1.0c | 1.0c | 1.0c | 1.2b | 1.2b | 1.3a | 0.1 | 0.001 |
| Discoloration3 | 1.0c | 1.0c | 1.0c | 1.0c | 1.0c | 1.0c | 1.2b | 1.2b | 1.3a | 0.1 | 0.001 |
| Surface discoloration4 | 1.0d | 1.0d | 1.0d | 1.0d | 1.0d | 1.0d | 1.2c | 1.3b | 1.4a | 0.1 | 0.001 |
| Color uniformity5 | 1.1e | 1.0e | 1.2d | 1.2d | 1.3c | 1.4c | 1.5b | 1.6b | 1.7a | 0.1 | 0.001 |
| Bone marrow color6 | 1.9g | 2.8f | 3.4d | 3.3e | 3.4e | 3.4de | 3.9c | 4.0b | 4.4a | 0.1 | 0.001 |
Within a row, means without a common superscript differ (P < 0.05).
Oxygenated lean color scale: 1 = extremely bright cherry red, 8 = extremely dark red.
Amount of browning scale: 1 = no evidence of browning, 6 = dark brown.
Discoloration scale: 1 = none, 5 = extreme.
Surface discoloration scale: 1 = no discoloration (0%), 6 = extensive discoloration (81% to 100%).
Color uniformity scale: 1 = uniform no two-toning, 5 = extreme two-toning.
Bone marrow color scale: 1 = bright reddish pink to red, 7 = black.
SEM = standard error of the mean.
When evaluating the lean tissue of the short ribs, an interaction between retail display time and treatment was not observed for L*, a*, or b* (P = 0.354, P = 0.925, and P = 0.366, respectively). Additionally, there was not a difference in L*, a*, or b* between treatments (P = 0.445, P = 0.412, and P = 0.855, respectively; Table 1). However, it is important to note all treatments had redness values greater than 14.5, which is the threshold for consumers’ acceptability (Holman et al., 2017). Throughout retail display, L*, a*, and b* values did differ (P < 0.001, P < 0.001, and P < 0.001, respectively; Table 3). Initial readings at 1 h were the darkest, reddest, and yellowest. Over time, steak lightness, redness, and yellowness fluctuated (P < 0.05). Steaks initially became darker before becoming lighter at the end of retail display. Although there was a significant difference in redness, a* values fluctuate by only 1.82 points throughout retail display. Interestingly, b* values taken in the morning (1, 19, 43, 67, and 91 h) decreased consistently over the display period; however, b* values take in the evening (7, 31, 55, and 79 h) were inconsistent. Previously, aged steaks declined in redness and yellowness during retail display (Colle et al., 2015, 2016). Throughout retail display, steaks maintained redness above the acceptability threshold, greater than 14.5 (Holman et al., 2017).
For the chuck roll steaks, an interaction between retail display time and antioxidant treatment was not observed for L* (P = 0.607) or b* (P = 0.591), but there was an interaction between treatment and time for a* (P = 0.018; Table 4). In general, across all treatments, steak redness declined, or became less red, over time of retail display. This is consistent with Gómez et al. (2016), who found redness decreased over retail display in ground beef patties regardless of antioxidant treatments. Additionally, McKenna et al. (2005) found that redness declined during retail display in the SV muscle. At 1 h, 31 h, and 91 h of retail display, a* values did not differ between treatments. The control steaks were the least red treatment at hour 7 (P < 0.05). All treatments throughout the entire retail display had redness values greater than 14.5, the threshold for consumers’ acceptability (Holman et al., 2017). Antioxidant treatments differed in L* (P < 0.001) but not b* (P = 0.186; Table 2). Steaks treated with C3 were darker (0.79 L* units) than the control steaks, which would likely be noticeable by customers at a retail case. Steak L* (P < 0.001) and b* (P < 0.001) values differed over time of retail display (Table 5). Steaks were lightest 19 h into retail display and darkest after 43 h. Steaks were yellowest between 1 and 7 h of retail display. This observation is consistent with previous research in which aged steaks darkened and declined in yellowness during retail display (Colle et al., 2015, 2016).
Topical antioxidant treatment by retail display time on chuck roll steak a* values (redness; n = 63; SEM = 0.79)
| Topical antioxidant treatment1 | |||||||
|---|---|---|---|---|---|---|---|
| Time of retail display (hours) | Control | C1 | C2 | C3 | R1 | R2 | R3 |
| 1 | 23.09a,u | 22.29a,u | 23.61a,u | 22.15a,uv | 23.80a,u | 23.69a,u | 23.78a,uv |
| 7 | 22.21b,uv | 23.08ab,u | 23.68ab,u | 23.89ab,u | 25.00a,u | 23.44ab,u | 24.22a,u |
| 19 | 21.05a,vw | 18.86b,vw | 20.35ab,v | 22.24a,uv | 20.37ab,v | 21.96a,uv | 22.18a,vw |
| 31 | 21.70a,uvw | 19.96a,vw | 20.53a,v | 19.67a,wx | 20.49a,v | 20.97a,v | 20.75a,w |
| 43 | 19.80ab,wx | 18.32ab,wx | 19.21ab,vw | 20.41a,vw | 19.61ab,v | 18.19b,w | 18.63ab,x |
| 55 | 18.14ab,xy | 16.16bc,y | 15.88c,y | 18.35a,xy | 16.73abc,w | 17.10abc,wx | 16.07c,z |
| 67 | 16.94abc,yz | 16.84abc,xy | 17.76a,wxy | 17.40ab,yz | 15.31bc,w | 15.30c,x | 18.22a,xy |
| 79 | 16.03ab,z | 15.90ab,y | 17.97a,wx | 16.19ab,z | 16.74ab,w | 15.64b,x | 16.37ab,y |
| 91 | 16.75a,yz | 16.44a,xy | 16.06a,xy | 15.43a,z | 14.81a,w | 16.34a,wx | 16.46a,y |
Within a row, means without a common superscript differ (P < 0.05).
Within a column, means without a common superscript differ (P < 0.05).
Treatments included an untreated control (C), topically sprayed (2 mL) with a 0.05% acerola cherry powder solution from 1 of 3 suppliers (C1, C2, or C3), or topically sprayed (2 mL) with a 0.10% rosemary extract solution from 1 of 3 suppliers (R1, R2, or R3).
SEM = standard error of the mean.
Estimated mean effects of retail display time on chuck roll steak color (n = 63)
| Time of retail display (hours) | |||||||||||
|---|---|---|---|---|---|---|---|---|---|---|---|
| Trait | 1 | 7 | 19 | 31 | 43 | 55 | 67 | 79 | 91 | SEM | P value |
| L* | 39.31bc | 39.19bc | 40.72a | 39.16bcd | 38.22e | 39.78b | 38.68cde | 38.31de | 38.88cde | 0.99 | 0.001 |
| b* | 15.73a | 15.25a | 15.09ab | 14.02c | 13.95c | 14.59bc | 12.76d | 12.27d | 12.14d | 0.32 | 0.001 |
| Oxygenated lean color1 | 4.1h | 4.3g | 4.9f | 5.3e | 5.4d | 5.6c | 5.9b | 6.0a | 6.1a | 0.2 | 0.001 |
| Amount of browning2 | 1.0h | 1.0h | 1.8g | 2.2f | 2.8e | 3.3d | 3.7c | 4.0b | 4.3a | 0.1 | 0.001 |
| Discoloration3 | 1.0h | 1.0h | 1.5g | 2.0f | 2.5e | 3.1d | 3.6c | 4.0b | 4.3a | 0.1 | 0.001 |
| Surface discoloration4 | 1.0h | 1.0h | 1.7g | 2.1f | 2.8e | 3.5d | 3.8c | 4.3b | 4.5a | 0.1 | 0.001 |
| Color uniformity5 | 1.5i | 1.7h | 2.2g | 2.3f | 2.6e | 3.0d | 3.3c | 3.7b | 3.9a | 0.1 | 0.001 |
Within a row, means without a common superscript differ (P < 0.05).
Oxygenated lean color scale: 1 = extremely bright cherry red, 8 = extremely dark red.
Amount of browning scale: 1 = no evidence of browning, 6 = dark brown.
Discoloration scale: 1 = none, 5 = extreme.
Surface discoloration scale: 1 = no discoloration (0%), 6 = extensive discoloration (81% to 100%).
Color uniformity scale: 1 = uniform no two-toning, 5 = extreme two-toning.
SEM = standard error of the mean.
Retail subjective color
In the short rib steaks, oxygenated lean color (P < 0.001) differed between treatments (Table 1). Steaks treated with antioxidants had a brighter oxygenated lean color than the control steaks. This supports the findings that ascorbic acid found in acerola cherry powder extends shelf life by delaying myoglobin oxidation (Buettner and Jerkiewicz, 1996). Interestingly, these results were not reflected when evaluating a* (objective redness), which was possibly due to how small the subjective color measurements differed numerically. Antioxidants did not impact amount of browning (P = 0.202), discoloration (P = 0.262), surface discoloration (P = 0.491), color uniformity (P = 0.307), or bone marrow color (P = 0.235; Table 1). Throughout retail display, there were changes in oxygenated lean color (P < 0.001), amount of browning (P < 0.001), discoloration (P < 0.001), surface discoloration (P < 0.001), color uniformity (P < 0.001), and bone marrow color (P < 0.001; Table 3). Oxygenated lean color darkened over retail display, with steaks being the brightest at the initial evaluation at 1 h and darkest at 79 and 91 h. Bone marrow color had the lowest score, or most desirable appearance, at the initial evaluation at 1 h. Steaks were the most uniform in color at hour 1 and hour 7. Until 55 h of retail display, steaks maintained a score of 1 in amount of browning, discoloration, and surface discoloration (no browning, no discoloration, and 0% metmyoglobin, respectively). Except for oxygenated lean color, all subjective color categories had the highest (least desirable) score at the final evaluation at 91 h. This observation supports previous research where aged steaks discolored during retail display (Colle et al., 2015, 2016; English et al., 2016).
Antioxidant treatments did not differ in chuck roll steak oxygenated lean color (P = 0.373), amount of browning (P = 0.801), discoloration (P = 0.924), surface discoloration (P = 0.584), or color uniformity (P = 0.552; Table 2). Throughout retail display, oxygenated lean color (P < 0.001), amount of browning (P < 0.001), discoloration (P < 0.001), surface discoloration (P < 0.001), and color uniformity (P < 0.001) values differed (Table 5). Steaks had the brightest oxygenated lean color and were most uniform in color at the initial evaluation. Steaks had the least amount of browning, discoloration, and surface discoloration at the initial evaluation and after 7 h of retail display. Steaks had the darkest oxygenated lean color at 79 and 91 h. For all remaining subjective color measurements, steaks had the least favorable evaluation after 4 d of retail display. Throughout retail display, lean color brightness and color uniformity decreased, whereas amount of browning, discoloration, and surface discoloration increased. This observation is consistent with previous research in which aged steaks discolored during retail display (Colle et al., 2015, 2016; English et al., 2016).
Metmyoglobin-reducing activity
There was an interaction for short rib steaks between retail display and treatment (P = 0.028; Figure 1). None of the antioxidant-treated steaks were significantly different than the control steaks on day 0 or day 4. Within treatment, MRA decreased from day 0 to day 4 for the control steaks and steaks treated with C1, C2, R1, and R3 (P < 0.05). Steaks treated with C3 and R2 did not differ in MRA from day 0 to day 4 of retail display (P > 0.05). There was also an interaction observed in the chuck roll steaks between retail display and treatment in MRA (P < 0.001; Figure 2). On day 0 of retail display, steaks treated with C1, C2, C3, R2, and R3 all had a higher, or more desirable, MRA than the control steaks (P < 0.05). However, on day 4, antioxidant-treated steaks did not have improved MRA compared to the control steaks (P > 0.05). Measuring MRA daily throughout retail display could determine the number of days that antioxidant-treated steaks had superior MRA. As expected, all treatments decreased in MRA from day 0 to day 4 (P < 0.05). MRA decreases over time due to decreasing nicotinamide adenine dinucleotide (NADH) levels postmortem and causes increased levels of metmyoglobin (Sammel et al., 2002; AMSA, 2012). Additionally, as aging time increases, initial MRA decreases, creating further color stability challenges (English et al., 2016). Utilizing antioxidants to increase MRA on day 4 could improve color stability of meat by delaying the onset of browning.
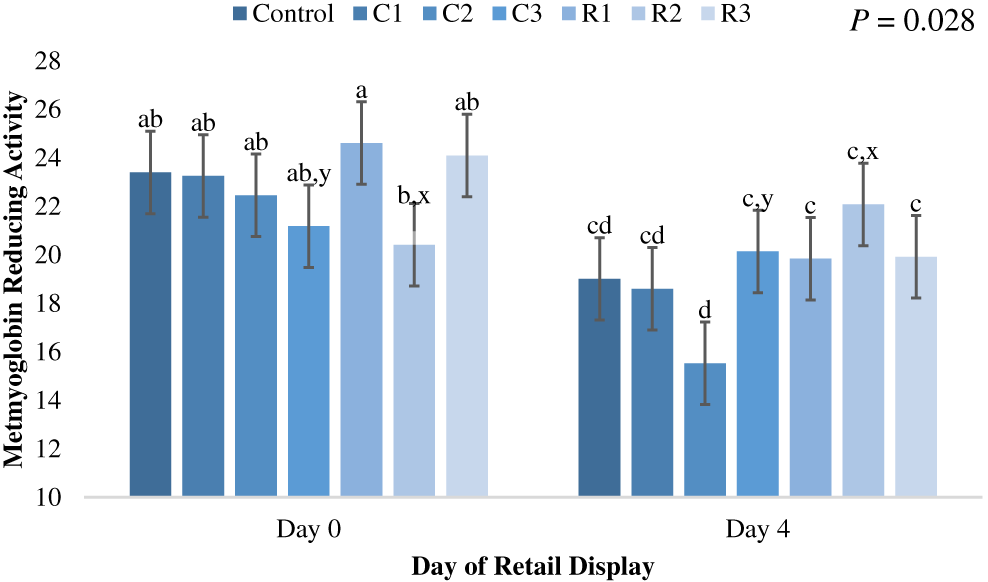
Metmyoglobin-reducing activity (MRA) values for antioxidant treatment by retail display time for bone-in short rib steaks (n = 63). Each steak was randomly assigned based on location to be an untreated control (C), topically sprayed (2 mL) with a 0.05% acerola cherry powder solution from 1 of 3 suppliers (C1, C2, or C3), or topically sprayed (2 mL) with a 0.10% rosemary extract solution from 1 of 3 suppliers (R1, R2, or R3). Steaks were overwrapped with an oxygen-permeable polyvinyl chloride film and displayed in a retail display room at 2°C for 4 d. MRA was determined on day 0 and day 4 of retail display for the control and each antioxidant treatment with the following equation: MRA = [(Initial % metmyoglobin − Final % metmyoglobin) ÷ Initial % metmyoglobin] × 100. Values are shown as least square means ± standard error. a–dWithin a day, means without a common superscript differ (P < 0.05). x,yWithin a treatment, means without a common superscript differ (P < 0.05).
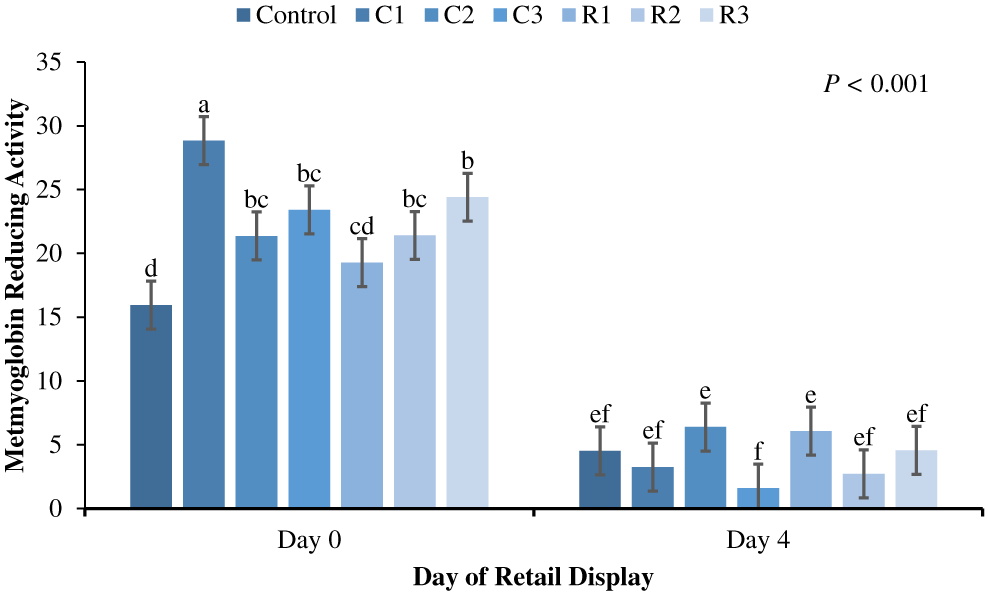
Metmyoglobin-reducing activity (MRA) values for antioxidant treatment by retail display time for chuck roll steaks (n = 63). Each steak was randomly assigned based on location to be an untreated control (C), topically sprayed (2 mL) with a 0.05% acerola cherry powder solution from 1 of 3 suppliers (C1, C2, or C3), or topically sprayed (2 mL) with a 0.10% rosemary extract solution from 1 of 3 suppliers (R1, R2, or R3). Steaks were overwrapped with an oxygen-permeable polyvinyl chloride film and displayed in a retail display room at 2°C for 4 d. MRA was determined on day 0 and day 4 of retail display for the control and each antioxidant treatment with the following equation: MRA = [(Initial % metmyoglobin − Final % metmyoglobin) ÷ Initial % metmyoglobin] × 100. Values are shown as least square means ± standard error. a–fMeans without a common superscript differ (P < 0.05).
Oxygen consumption
Treatments did not impact short rib steak OC (P = 0.224; Table 1). Similarly, in chuck roll steaks, treatments did not impact OC (P = 0.053; Table 2). Previous research also did not see changes in OC caused by antioxidants (Colle et al., 2019). The ability to maintain moderate OC throughout retail display could stabilize color by regenerating NADH levels for MRA without reducing the oxygen partial pressure at the surface (Sammel et al., 2002). Mitochondria generate NADH after consuming oxygen to produce energy (Mancini and Ramanathan, 2014). Unfortunately, with longer shelf-life periods, OC by mitochondria would be difficult to quantify because of potential oxygen-consuming microorganisms and oxygen involved in lipid oxidation.
Lipid oxidation
There was not an interaction in short rib steaks between day of retail display and treatment (P = 0.191) or a treatment influence on lipid oxidation (P = 0.323; Table 1). Also, in the chuck roll steaks, a retail display by treatment interaction (P = 0.829) was not observed. Furthermore, a difference in lipid oxidation between treatments was not observed (P = 0.276; Table 2). Similar results were found in the Semimembranosus and Longissimus lumborum when ascorbic acid and rosemary extract were topically applied (Colle et al., 2019). Other previous research has shown a delay in lipid oxidation; however, in these studies, the antioxidants were mixed into a ground product (Ismail et al., 2009; Kim et al., 2013; Gómez et al., 2016; Zhang et al., 2016). Previously, adding vitamin E to cattle diets decreased lipid oxidation in ground beef after 6 d of retail display (Faustman et al., 1989). Vitamin E works to delay lipid oxidation by quenching free radicals created by oxidizing fatty acids (Murray et al., 2006). Increasing the penetration depth of antioxidants into steaks could delay the oxidation of lipids below the steak surface without having to adjust US feeding strategies. Additionally, decreasing lipid oxidation would prevent myoglobin oxidation and, thus, steak discoloration (Mancini and Hunt, 2005). As anticipated, lipid oxidation increased in short rib steaks (P < 0.001) from day 0 to day 4 of retail display (0.15 to 0.78 mg malondialdehyde/kg meat, respectively) and chuck roll steaks (P < 0.001) from day 0 to day 4 of retail display (0.31 to 1.00 mg malondialdehyde/kg meat, respectively), similar to previous research (Kim et al., 2013; Colle et al., 2019). The lipid oxidation threshold for the ability of consumers to detect off-flavors in meat is TBARS > 1.0 (Tarladgis et al., 1960; Greene and Cumuze, 1981). It is important to note that in short rib steaks on day 4 of retail display, none of the treatments were above the lipid oxidation threshold. However, in the chuck roll steaks on day 4 of retail display, the control steaks and steaks treated with C1, C3, R1, and R2 were above the lipid oxidation threshold with values of 1.09, 1.01, 1.05, 1.03, and 1.07, respectively. Further research is needed to collect consumer sensory data to determine if off-flavors are detectable under the experimental conditions of the present study.
Conclusion
During retail display antioxidant treatments of acerola cherry powder and rosemary extract improved beef bone-in short rib bone marrow redness as well as beef chuck roll MRA when aged 28 d postfabrication. Simple topical applications at a retail meat merchandising setting following extended aging, either due to lengthy storage or transportation duration, can extend the shelf-life stability of fresh beef bone-in short ribs and chuck rolls. Further research is needed to determine if utilizing antioxidants in combination with one another will further extend shelf life. Additional investigation of using acerola cherry powder and rosemary extract in higher concentrations may further delay myoglobin and lipid oxidation.
Acknowledgements
This research was funded by The Beef Checkoff. We gratefully acknowledge financial support from Checkoff dollars provided by the Idaho Beef Council. Support for this research project was also provided by the Idaho Agriculture Experiment Station. We are also appreciative for the personnel at the University of Idaho Vandal Brand Meats Lab that made this research possible.
Literature Cited
Aberle, E. D., J. C. Forrest, D. E. Gerrard, and E. W. Mills. 2012. Principles of meat science. 5th ed. Kendall Hunt Publ. Co., Dubuque, IA.
AMSA. 2012. Meat color measurement guidelines. 2nd ed. American Meat Science Association, Champaign, IL.
Buettner, G. R., and B. A. Jurkiewicz. 1996. Catalytic metals, ascorbate and free radicals: Combinations to avoid. Radiat. Res. 145:532–541. doi: https://doi.org/10.2307/3579271.
Colle, M. J., R. P. Richard, K. M. Killinger, J. C. Bohlscheid, A. R. Gray, W. I. Loucks, R. N. Day, A. S. Cochran, J. A. Nasados, and M. E. Doumit. 2015. Influence of extended aging on beef quality characteristics and sensory perception of steaks from the gluteus medius and longissimus lumborum. Meat Sci. 110:32–39. doi: https://doi.org/10.1016/j.meatsci.2015.06.013.
Colle, M. J., R. P. Richard, K. M. Killinger, J. C. Bohlscheid, A. R. Gray, W. I. Loucks, R. N. Day, A. S. Cochran, J. A. Nasados, and M. E. Doumit. 2016. Influence of extended aging on beef quality characteristics and sensory perception of steaks from the biceps femoris and semimembranosus. Meat Sci. 119:110–117. doi: https://doi.org/10.1016/j.meatsci.2016.04.028.
Colle, M. J., R. P. Richard, M. C. Colle, W. I. Loucks, G. K. Murdoch, P. D. Bass, C. J. Williams, and M. E. Doumit. 2019. Retail display properties and consumer perception of extended aged beef topically treated with ascorbic acid and rosemary extract. Meat Muscle Biol. 3:42–50. doi: https://doi.org/10.22175/mmb2018.05.0011.
Djenane, D., A. Sánchez-Escalante, J. A. Beltrán, and P. Roncalés. 2003. The shelf-life of beef steaks treated with DL-lactic acid and antioxidants and stored under modified atmospheres. Food Microbiol. 20:1–7. doi: https://doi.org/10.1016/S0740-0020(02)00138-7.
English, A. R., G. G. Mafi, D. L. VanOverbeke, and R. Ramanathan. 2016. Effects of extended aging and modified atmospheric packaging on beef top loin steak color. J. Anim. Sci. 94:1727–1737. doi: https://doi.org/10.2527/jas.2015-0149.
Faustman, C., R. G. Cassens, D. M. Schaefer, D. R. Buege, S. N. Williams, and K. K. Scheller. 1989. Improvement of pigment and lipid stability in Holstein steer beef by dietary supplementation with vitamin E. J. Food Sci. 54:858–862. doi: https://doi.org/10.1111/j.1365-2621.1989.tb07899.x.
Gill, C. O. 1996. Extending the storage life of raw chilled meats. Meat Sci. 43:99–109. doi: https://doi.org/10.1016/0309-1740(96)00058-7.
Gómez, I., M. J. Beriain, J. A. Mendizabal, C. Realini, and A. Purroy. 2016. Shelf life of ground beef enriched with omega-3 and/or conjugated linoleic acid and use of grape seed extract to inhibit lipid oxidation. Food Science & Nutrition. 4:67–79. doi: https://doi.org/10.1002/fsn3.251.
Greene, B. E., and T. H. Cumuze. 1981. Relationship between TBA numbers and inexperienced panelists’ assessment of oxidized flavor in cooked beef. J. Food Sci. 47:52–54. doi: https://doi.org/10.1111/j.1365-2621.1982.tb11025.x.
Holman, B. W. B., R. J. van de Ven, Y. Mao, C. E. O. Coombs, and D. L. Hopkins. 2017. Using instrumental (CIE and reflectance) measures to predict consumers’ acceptance of beef colour. Meat Sci. 127:57–62. doi: https://doi.org/10.1016/j.meatsci.2017.01.005.
Ismail, H. A., E. J. Lee, K. Y. Ko, H. D. Paik, and D. U. Ahn. 2009. Effect of antioxidant application methods on the color, lipid oxidation, and volatiles of irradiated ground beef. J. Food Sci. 74:C25–C32. doi: https://doi.org/10.1111/j.1750-3841.2008.00991.x.
Kim, S.-J., S. C. Min, H.-J. Shin, Y.-J. Lee, A. R. Cho, S. Y. Kim, and J. Han. 2013. Evaluation of the antioxidant activities and nutritional properties of ten edible plant extracts and their application to fresh ground beef. Meat Sci. 93:715–722. doi: https://doi.org/10.1016/j.meatsci.2012.11.029.
Lanari, M. C., D. M. Schaefer, and K. K. Scheller. 1995. Dietary vitamin E supplementation and discoloration of pork bone and muscle following modified atmosphere packaging. Meat Sci. 41:237–250. doi: https://doi.org/10.1016/0309-1740(95)00006-7.
Lawrie, R. A., and D. A. Ledward. 2006. Lawrie’s meat science. 7th ed. Woodhead Publishing, Cambridge, UK.
Mancini, R. A., and M. C. Hunt. 2005. Current research in meat color. Meat Sci. 71:100–121. doi: https://doi.org/10.1016/j.meatsci.2005.03.003.
Mancini, R. A., and R. Ramanathan. 2014. Effects of postmortem storage time on color and mitochondria in beef. Meat Sci. 98:65–70. doi: https://doi.org/10.1016/j.meatsci.2014.04.007.
Mancini, R. A., M. C. Hunt, K. A. Hachmeister, D. H. Kropf, and D. E. Johnson. 2004. Ascorbic acid minimizes vertebrae discoloration. Meat Sci. 68:339–345. doi: https://doi.org/10.1016/j.meatsci.2004.03.017.
McKenna, D. R., P. D. Mies, B. E. Baird, K. D. Pfeiffer, J. W. Ellebracht, and J. W. Savell. 2005. Biochemical and physical factors affecting discoloration characteristics of 19 bovine muscles. Meat Sci. 70:665–682. doi: https://doi.org/10.1016/j.meatsci.2005.02.016.
Murray, R. K., D. K. Granner, and V. W. Rodwell. 2006. Harper’s illustrated biochemistry. 27th ed. McGraw Hill, New York.
Oswell, N. J., H. Thippareddi, and R. B. Pegg. 2018. Practical use of natural antioxidants in meat products in the U.S.: A review. Meat Sci. 145:469–479. doi: https://doi.org/10.1016/j.meatsci.2018.07.020.
Sammel, L. M., M. C. Hunt, D. H. Kropf, K. A. Hachmeister, and D. E. Johnson. 2002. Comparison of assays for metmyoglobin reducing ability in beef inside and outside semimembranosus muscle. J. Food Sci. 67:978–984. doi: https://doi.org/10.1111/j.1365-2621.2002.tb09439.x.
Tarladgis, B. G., B. M. Watts, M. T. Younathan, and L. Dugan, Jr. 1960. A distillation method for the quantitative determination of malonaldehyde in rancid foods. J. Am. Oil Chem. Soc. 37:44–48. doi: https://doi.org/10.1007/BF02630824.
USDA FAS. 2020. South Korea 2019 export highlights. https://www.fas.usda.gov/south-korea-2019-export-highlights. (Accessed 4 January 2021.)
USMEF. 2020. U.S. Meat Export Federation annual report 2019. https://www.usmef.org/downloads/2019-USMEF-Annual-Report.pdf. (Accessed 22 January 2020.)
USMEF. 2021. U.S. Meat Export Federation annual report 2020. https://www.usmef.org/downloads/2020-USMEF-Annual-Report.pdf. (Accessed 14 January 2021.)
Zhang, X., D. Li, Q. Meng, C. He, and L. Ren. 2016. Effect of mulberry leaf extracts on color, lipid oxidation, antioxidant enzyme activities and oxidative breakdown products of raw ground beef during refrigerated storage. J. Food Quality. 39:159–170. doi: https://doi.org/10.1111/jfq.12187.