
Introduction
When beef tenderness is deemed acceptable, the next most important attribute evaluated by consumers is flavor (Miller and Kerth, 2012; Legako et al., 2015; Miller et al., 2019). Prior work has indicated that beef cut, or muscle type, greatly influences beef palatability attributes, such as flavor (Rhee et al., 2004; Chail et al., 2017; Nyquist et al., 2018). Differences in flavor may be due in part to compositional differences among beef muscles, such as fatty acid composition (Hunt et al., 2016), where fatty acid composition may further contribute to rates of oxidation, ultimately developing negative flavors (Elmore et al., 1999; Dinh et al., 2021).
Packaging environment may also influence oxidation of fatty acids, magnifying lipid compositional differences and subsequent flavor development among beef muscles (Kim et al., 2010). While packaging methods such as high-oxygen or modified atmosphere packaging are common and provide an attractive product, high levels of oxygen contribute to rapid oxidation of fresh meat (Ponce et al., 2019; Vierck et al., 2020). Oxidation will lead to off-flavor development, such as oxidized, cardboardy, or rancid (St. Angelo et al., 1987; Ba et al., 2012). Furthermore, these packaging types and high levels of oxygen in a package may also contribute to tenderness differences, creating a tougher product (Lund et al., 2007; Vierck et al., 2020). Conversely, vacuum-packaged beef has been shown not to be detrimental to beef flavor or tenderness (Sitz et al., 2006; Ponce et al., 2019; Vierck et al., 2020). The use of vacuum-sealed and vacuum-flexible packaging—commonly referred to as “vacuum rollstock packaging” (VRP)—in retail display cases has continued to increase in recent years. The 2015 National Meat Case Study showed that VRP had increased from 17% of retail cases in 2010 to 24% of retail cases in 2015. With this increase, more retail cuts, such as steaks, are being displayed within VRP. Although vacuum packaging is known to extend storage life at refrigerated temperatures (Bell et al., 1996; O’Quinn et al., 2012), little information is available regarding the quality of individually packaged beef steaks in VRP throughout retail display.
Retail displays commonly use fluorescent (FLUR) or light-emitting diode (LED) lighting. Retail lighting may ultimately increase rates of photo-oxidation and oxidation products (Dominguez et al., 2019). Others have indicated that LED promotes lipid oxidation in comparison to FLUR lighting when beef was packaged in polyvinyl chloride overwrap over 7 d (Steele et al., 2016). Nonetheless, the production of secondary oxidation products in vacuum packaging due to lighting alone may be limited. However, primary lipid oxidation products, including conjugated dienes and their products, may have the potential to contribute to negative flavor attributes with increased display (Gray and Monahan, 1992). Considering the impact of lighting, it is plausible that steaks in VRP with longer shelf-life expectations may experience greater retail lighting exposure prior to consumption, compared with traditional package types with brief retail display periods. It is, however, unknown whether lighting exposure from LED or FLU lighting will influence the quality of beef steaks displayed in VRP. This study aimed to evaluate the quality of individual beef steaks in VRP held under FLUR or LED lighting throughout retail display.
Materials and Methods
Product collection and fabrication
Paired strip loins (Institutional Meat Purchase Specification [IMPS] 180; NAMP, 2014), paired top sirloin butts (IMPS 184; NAMP, 2014), and paired tenderloins (IMPS 189A; NAMP, 2014) were collected from USDA Low Choice (Small00 to Small100 marbling score), “A” maturity beef steer carcasses (n = 16) at a commercial processing facility. Subprimal collection was done on 2 separate days, where 8 carcasses were included each time. USDA yield and quality grade carcass characteristics displayed in Table 1 show mean carcass maturity and marbling scores, as well as fat thickness and ribeye areas for selected carcasses. Paired strip loins, tenderloins, and top sirloin butts were identified and collected from each side of the beef carcass during fabrication. The collected subprimals were vacuum packaged, boxed, and shipped to the Gordon W. Davis Meat Laboratory at Texas Tech University (Lubbock, TX).
Least-squares means (±SEM1) of beef carcass (n = 16) measurements
| Carcass Characteristics | ||
|---|---|---|
| Quality Attributes | ||
| Lean maturity2 | 56 ± 6.3 | |
| Skeletal maturity3 | 34 ± 7.9 | |
| Marbling score4 | 455 ± 5.8 | |
| Yield Attributes | ||
| Preliminary fat thickness, cm | 3.1 ± 0.2 | |
| Adjusted fat thickness, cm | 3.2 ± 0.2 | |
| Ribeye area, cm2 | 91.6 ± .2 | |
Standard error of the mean.
0–100 = Light cherry-red; 101–200 = Light cherry-red to slightly dark; 201–300 = Moderately light red to moderately dark red; 301–400 = Moderately dark red to dark red; 401–500 = Dark red to very dark red.
0–100 = A maturity, approximately 9–30 mo of age; 101–200 = B, approximately 30–42 mo of age; 201–300 = C, approximately 42–72 mo of age; 301–400 = D, approximately 72–96 mo of age; 401–500 = E, >96 mo of age.
200 = Traces; 300 = Slight; 400 = Small; 500 = Modest; 600 = Moderate.
All subprimals were wet aged under vacuum, stored in darkness under refrigeration (0°C to 4°C), and aged until 7 d postmortem. After initial aging, all strip loins, tenderloins, and top sirloin butts were fabricated to remove excess fat and cut to produce 2.54-cm Longissimus lumborum (LL), Psoas major (PM), and Gluteus medius (GM) steaks per subprimal (n = 768), respectively. All subprimals were sliced anterior to posterior, with excess fat trimmed to 0.63 cm on LL steaks and heavy connective tissue removed from PM and GM steaks. LL steaks with the GM present were excluded from the study. PM steaks excluded the M. Psoas minor, and the Top Sirloin Butt separated the GM from the M. Biceps femoris so as only to use the denuded GM. From each subprimal, 8 steaks were produced. Each fabricated steak was then allotted to its own VRP and randomly assigned to one of 4 display periods—0, 2, 6, and 10 d—and one of 2 lighting types: LED (Lux intensity; top shelf = 2,171 ± 73, middle shelf = 4,167 ± 132, bottom shelf = 2,442 ± 55) or FLUR (Lux intensity; top shelf = 2,644 ± 73, middle shelf = 3,591 ± 132, bottom shelf = 2,532 ± 55) display. The VRPs were produced using a Multivac packaging machine (MULTIVAC; Multivac Inc., Kansas City, MO) with 422 mm × 609 m transparent forming web (forming film; T6035B, CRYOVAC, Sealed Air Corporation, Charlotte, NC). Following packaging, all fabricated steaks were stored in darkness again and under refrigeration (0°C to 4°C) for an additional 7 d to simulate distribution prior to display. At 14 d postmortem, the packages designated to 2, 6, and 10 d of aging in LED or FLUR were removed from dark storage and displayed in multideck style retail cases (n = 2; Model M3-8EA, Hussmann Corporation, Bridgeton, MO) (0°C to 4°C) for their respective aging periods under continuous lighting sources. Each multideck retail case contained both lighting sources with a vertical central divider preventing cross-over lighting. Those steaks designated to 0 d of display were immediately frozen (−20°C) for further analysis. All steaks were rotated every 12 h within their lighting sources to ensure packages were held at similar temperatures and lighting intensities throughout the case. Retail case temperatures were monitored continuously with remote temperature recorders (Multi-trip; Temprecord Monitor Company, Modesto, CA) recording temperatures in 30-min intervals. Temperature did not differ (P = 0.147) between FLUR (2.22°C ± 0.25) and LED (2.59°C ± 0.25) case sections. After the completion of each designated display period, assigned steaks were frozen at −20°C until subsequent analyses.
L*a*b* color evaluation
The L*, a*, and b* values were read (n = 3) and recorded every 12 h during the entire display period on steaks receiving 10-d aging treatments in both lighting displays. A Hunter MiniScan EZ 4500 (Hunter Associates Laboratory, Inc. Reston, VA) with 45°/0° directional viewing geometry, 31.8 mm port, and 25 mm viewed area was used to evaluate L*, a*, and b* values. The spectral range of the colorimeter determined values between 400 nm and 700 nm. Hue angle (color) and chroma (saturation index) were evaluated using a* and b* values (American Meat Science Association [AMSA], 2012). Hue angle was calculated using the equation Hue Angle (Hab) = tan − 1 (b*/a*). Chroma was calculated with the equation Chroma = (a*2 + b*2)½.
Cooking method
Prior to cooking, steaks were tempered at 2°C to 4°C for 24 h to thaw. Steaks were cooked using electric rational ovens (Model SCC WE 62G; Rational USA, Commercium Rolling Meadows, IL) at 204°C and 0% humidity. Steaks were pulled from the ovens accordingly to reach a peak internal temperature of 71°C, a medium degree of doneness. Raw and cooked temperatures (Thermapen, Classic Super-Fast, Thermoworks, American Fork, UT) and weights were recorded for steaks designated for cooked analysis and served in trained panels.
Cooked homogenate
Immediately following cooking, steaks designated for volatile analysis were cut into steak thickness × 1 cm × 1 cm cubes with the outer edges, accessory muscles (i.e., Psoas minor, Multifidus dorsi, etc.), fat, and connective tissue removed and discarded. The cubes were flash frozen with liquid nitrogen and homogenized (Robot Coupe, Blixer 3 Food Processor, Robot Coupe, Jackson, MS). Frozen homogenates were stored at −80°C until subsequent analyses.
Descriptive trained sensory analysis
Trained descriptive panelists, consisting of graduate students and staff from the Texas Tech University Department of Animal and Food Sciences, participated in evaluating samples for multiple sensory attributes utilizing the AMSA sensory guidelines (AMSA, 2015). Panelists were trained and tested for approximately 40 h to objectively evaluate intensities described by Adhikari et al. (2011) (Table 2): beef flavor identity, brown/roasted, bloody/serumy, fat-like, liver-like, oxidized, umami, sweet, salty, bitter, and sour. Panelists were also asked to rate each sample for overall juiciness and tenderness. The samples were quantified by panelists on an unstructured line scale from 0 to 100, with “0” representing the absence of a specific flavor, extremely tough, or extremely dry and “100” representing extreme intensity of a specific flavor, extremely tender, or extremely juicy. The ballots were provided to panelists via electronic tablets (iPad; Apple Inc., Cupertino, CA) using electronic surveys (Qualtrics, Provo, UT).
Descriptive attributes and references
| Flavor Attribute | Anchor | Location on Scale (0–100) |
|---|---|---|
| Beef Flavor Identity | Beef broth (heated to 74°C, served warm) | 30 |
| 80% ground chuck (71°C internally) | 50 | |
| Brisket (71°C internally) | 75 | |
| Bloody/Serumy | USDA Choice strip steak (60°C internally) | 40 |
| Brown/Roasted | 80% ground chuck (71°C internally) | 40 |
| Well done strip steak (77°C internally) | 65 | |
| Fat-like | 90/10 ground beef (71°C internally) | 30 |
| 70/30 ground beef (71°C internally) | 60 | |
| Liver-like | Flat iron steak (71°C internally) | 20 |
| Calf liver | 90 | |
| Oxidized | Microwaved vegetable oil | 30 |
| Cooked, stored (12 h at 4°C), and microwaved ground beef (71°C internally) | 60 | |
| Buttery | Unsalted butter, 0.1-cm-thick slice | 65 |
| Fishy | Cod liver oil | 30 |
| Canned tuna | 60 | |
| Umami | Beef broth, sodium free (heated to 74°C, served warm) | 30 |
| Sour | 0.015% Citric acid | 10 |
| 0.050% Citric acid | 25 | |
| Salty | 0.15% NaCl | 10 |
| 0.25% NaCl | 45 | |
| Bitter | 0.01% Caffeine | 15 |
| 0.02% Caffeine | 25 | |
| Overall Tenderness | Eye of round (77°C internally) | 30 |
| Strip steak (71°C internally) | 55 | |
| Tenderloin (65°C internally) | 90 | |
| Overall Juiciness | Strip steak (85°C internally) | 25 |
| Strip steak (71°C internally) | 50 | |
| Strip steak (60°C internally) | 75 |
Steaks from all carcasses of each muscle type (n = 384) were randomly served over 52 panel sessions. Panel sessions were completed over a 31-d period, with each day consisting of 2 panels per day with 2 sessions per panel. On days on which 2 panels occurred, a 10-min break was given between sessions and an 8-h break was given between panels. No more than 8 samples were evaluated in a single session.
Steaks were thawed at 2°C to 4°C for 24 h prior to panels and cooked as previously described. Once the steaks reached peak temperatures, they were immediately weighed, then wrapped in aluminum foil and transported to the serving room. Samples were held (Cambro Ultra Heated Holding Pan Carrier, 214UPCH400, Webstaurant Store, Lititz, PA) at 50°C to 55°C for no longer than 5 min prior to serving. Steaks were then sliced into steak thickness × 1.27 × 1.27 cm pieces (1/2” sensory box; Tallgrass Solutions Inc, Manhattan, KS), and a minimum of 2 cubes were placed in portion cups and served to the panelists. The panelists were provided a toothpick, napkin, and an expectorant cup, as well as unsalted crackers, a cup of distilled water, and diluted apple juice to serve as palate cleansers between samples. Panelists were asked to evaluate all samples in a booth with red incandescent lighting above to mask any visible differences between samples.
Volatile compound analysis
Volatile compound analysis (n = 384) was performed on cooked steaks using methods similar to Gardner and Legako (2018). Five grams of powdered sample was weighed into 20 mL glass vials (Gerstel, Linthicum, MD) and sealed using a polytetrafluoroethylene septa and screw cap (Gerstel). Prior to sealing, 10 μL of internal standard (1,2-dichlorobenzene, 25 ng/μL) was added to the ground sample. The sealed vials were then loaded onto a Gerstel automated sampler (Multipurpose Sampler) for a 5-min incubation period at 65°C in the Gerstel agitator. Following incubation, a 25-min extraction phase was used to collect volatile compounds from the headspace of the cooked homogenates by solid phase microextraction using an 85 μm film thickness carboxen polydimethylsiloxane fiber (Supelco, Bellefonte, PA). Extraction and injection of volatile compounds were carried out using a Gerstel automated solid phase microextraction sampler (Multipurpose Sampler; Gerstel Inc, Linthicum, MD). Following extraction, the volatile compounds were desorbed and separated by gas chromatography using a VF-5 MS capillary column (30 m × 0.25 mm ×1.00 mm; Agilent J&W GC Columns, Netherlands). After separation, volatile compounds were detected by a mass spectrometer. Ions were detected within a range of 45 to 500 m/z with electron ionization at 70 eV. Volatiles compound identities were validated by an authentic standard (Sigma-Aldrich, St. Louis, MO) comparison of ion fragmentation patterns and retention times. Quantitative determinations of compounds of interest were conducted by an internal standard calibration, and data were expressed as quantity extracted in nanograms per sample weight in grams.
Statistical analysis
Retail display case temperature and instrumental color analysis
Retail display temperature data and instrumental color scores were analyzed using the GLIMMIX procedure of SAS (version 9.4; SAS Institute, Cary, NC). Lighting, cut, and day served as main effects, with individual packages representing the repeated measure. The covariance structure showing the lowest Akaike information criterion was used. Probability values (P values) less than or equal to α = 0.05 were considered significant. The Kenward-Rogers adjustment was also used to estimate denominator degrees of freedom.
Descriptive trained sensory analysis and volatile compound analysis
Data were analyzed as a split-split plot and sliced by muscle, with subprimal serving as the whole plot, lighting type as the sub plot, and retail display day as the sub-sub plot, in which steak served as the experimental unit at the sub-sub plot level. For cooked analyses, peak temperature and cook loss were included as covariates. Probability values (P values) less than or equal to α = 0.05 were considered significant. The Kenward-Rogers adjustment was also used to estimate denominator degrees of freedom. The PROC GLIMMIX procedure of SAS (version 9.4; SAS Institute, Cary, NC) was used to evaluate all trained sensory and volatile compound data. Additionally, a discriminant function analysis (DFA) was completed for all volatile compound and trained sensory analyses using R statistical software (version 4.0.2; R Core Team). A DFA was used to assess differences of individual treatments in a multivariate space. Highly correlated values were removed at r > 0.50. Loadings and standardized coefficients for variables were assessed on each function, and standardized coefficients were used to generate composite scores of each significant treatment (i.e., lighting, age, and cut). Significant effects were determined at P < 0.05.
Results and Discussion
Instrumental color scores
An interaction (P ≤ 0.034) between lighting type and muscle type revealed lower L*, a*, and b* values for muscles under LED lighting (Table 3). All steaks stored under FLUR lighting showed similar (P > 0.05) L* values, whereas L* values were lower for only LL and PM steaks under LED lighting (P > 0.05), signifying darker products. The GM, on the other hand, showed the opposite, with greater L* values, or lighter steaks, under LED lighting (P < 0.05). Redness values, or a*, were greater (P < 0.05) under FLUR lighting for GM and PM steaks, whereas LL were similar (P > 0.05) in both lighting types. As demonstrated by prior studies, LL steaks in the current study appear to have greater color stability compared with the PM, despite lighting variation (Joseph et al., 2012). Under LED lighting, GM steaks showed lower a* values (P < 0.05), whereas the PM showed values similar (P > 0.05) to the LL. Color scores for b* values were higher (P < 0.05) under FLUR light for LL and PM steaks. The GM, however, showed similar (P > 0.05) b* values in both LED and FLUR light. Overall, small differences in instrumental color scores may be explained not by lighting type but lighting intensities (Marriot et al., 1967; Bala and Naumann, 1977). In the current study, the distance between light sources varied by deck within the case but was mitigated by consistent rotation of products within the assigned case. Still, while overall changes in L*, a*, and b* color values revealed little to no differences in the current study, lighting intensity may be another factor to evaluate further.
Least-squares means of L*, a*, and b* instrumental color scores, hue angle, and chroma under two lighting sources1 across all muscle types2
| Lighting and Muscle Type | ||||||||
|---|---|---|---|---|---|---|---|---|
| LED | FLUR | |||||||
| Color Value | GM | LL | PM | GM | LL | PM | SEM3 | P Value |
| L* | 41.331a | 39.369c | 39.500c | 40.505b | 40.271b | 40.094b | 0.23 | <0.001 |
| a* | 24.030b | 22.526d | 22.627d | 24.308a | 22.571d | 23.207c | 0.08 | <0.001 |
| b* | 13.146a | 11.297c | 10.901d | 13.202a | 11.520b | 11.271c | 0.07 | 0.034 |
Light-emitting diode (LED) and fluorescent (FLUR).
Gluteus medius (GM), Longissimus lumborum (LL), Psoas major (PM).
Standard error of the least-squares mean (largest).
Means within a row lacking a common superscript differ (P < 0.05).
Despite the statistical differences exhibited, biological significance is difficult to determine using only instrumental color values. However, AMSA’s Meat Color Measurement Guidelines (2012) discusses delta color change, evaluated using the equation Δ* = [(ΔL*)2 + (Δa*)2 + (Δb*)2]1/2. Delta color change, also known as total color change, is useful in determining differences over time regarding L*, a*, and b* color values. According to the Guidelines (AMSA, 2012), ΔEs of less than 1.0 are not detectable unless the samples are side by side. All differences for LL, GM, and PM steaks were less than 1.0 (LL = 0.42 ± 0.016, GM = 0.37 ± 0.016, PM = 0.38 ± 0.016), indicating little distinguishable difference among steaks. The data presented differ from prior research describing color stability among muscles, wherein the PM was shown to have the least shelf-stable color and the LL had substantially greater stability (O’Keeffe and Hood, 1982; Lanari and Cassens, 1991). Although the studies listed did not evaluate color during display, they do aide in explaining stability of muscles during color transitioning. Nonetheless, vacuum packaging has been shown to preserve color longer than other forms of packaging (Seideman and Durland, 1983).
For this study, color value scores were evaluated to monitor visual quality throughout display duration. However, minimal discoloration occurred, at least from a detectable limit, owing to the fact that color is the last quality attribute to decline in vacuum packaging. A study analyzing packaging types and color stability over a 9-d period in various muscles showed a* values—or redness—increasing in semimembranosus steaks and no change in LL steaks packaged under vacuum compared with the same muscles in high-oxygen packaging (Kim et al., 2010). The current study is in agreement and was evidenced by a maintenance—or minimally detected change—of color throughout the entire display period in vacuum packaging.
Descriptive trained sensory analysis
Lighting type × display duration interaction
There were no three-way interactions between packaging, lighting, and days of age (P ≥ 0.120) for any flavor attribute. A two-way interaction (P ≤ 0.001) between lighting type and days of retail display (Table 4) showed steaks becoming more tender as display duration increased. All steaks were similar (P > 0.05) in tenderness at day 0. However, steaks under LED lighting increased in tenderness (P < 0.05) beginning day 2, whereas those under FLUR lighting were more tender after day 6. Still, steaks in both lighting types were similar (P > 0.05) at day 10. While tenderness changes based on lighting type are still not fully known, proteolysis and protein cross-linking may be impacted by lighting types. Estévez and Luna (2017) discussed protein oxidation and its contribution to increased shear force values. This oxidation process may disrupt the functionality of amino acid side chain resulting in cross-linkage of proteins. This, in turn, may alter food properties, such as texture, color, and flavor (McKerchar et al., 2019).
Two-way interaction between lighting type1 and display duration2 for significant3 flavor attributes
| Lighting Type and Display Duration | ||||||||||
|---|---|---|---|---|---|---|---|---|---|---|
| LED | FLUR | |||||||||
| Attribute | 0 | 2 | 6 | 10 | 0 | 2 | 6 | 10 | SEM4 | P Value |
| Salty | 2.6cd | 2.9bcd | 2.8cd | 3.7a | 2.5d | 3.2abc | 3.5ab | 3.1abc | 0.22 | <0.001 |
| Tenderness | 55.6b | 60.2a | 60.3a | 61.8a | 55.8b | 56.9b | 54.2b | 62.1a | 1.08 | <0.001 |
| Umami | 17.7abc | 18.6ab | 14.0d | 16.0c | 17.7abc | 19.1a | 16.9bc | 13.8d | 0.70 | <0.001 |
Light-emitting diode (LED) and fluorescent (FLUR).
0 d, 2 d, 6 d, and 10 d.
Significant attributes determined at P ≤ 0.05. Full list of attributes included beef flavor identity, brown/roasted, bloody/serumy, fat-like, liver-like, oxidized, umami, sweet, salty, bitter, sour, overall tenderness, and overall juiciness.
Standard error of the least-squares mean (largest).
Means within a row lacking a common superscript differ (P < 0.05).
Umami flavor intensities decreased (P < 0.05) for both lighting types over time, but steaks under FLUR displays were lower (P < 0.05) in umami intensity at day 10. These results are in disagreement with those found in other reviews, which note that umami flavors typically increase with refrigerated aging (Dashdorj et al., 2015). Still, the results in the current study do agree with theories of a masking effect, stating that positive notes are hidden under stronger off-notes (Stutz et al., 1991; Jackson et al., 1992), despite off-notes not being impacted by the interaction. Furthermore, peptides and amino acids, such as hypoxanthine, anserine, carnosine, arginine, leucine, and tryptophan, may contribute to bitter flavors in aged beef (Brewer, 2007). Similarly, a study by Nishimura et al. (1988) found increased concentrations of hypoxanthine in beef during storage, as well as increases in anserine and carnosine, although insignificant. These small increases may be enough to contribute to bitter flavors with increased aging of products and may further contribute to the masking effect.
Lighting type × muscle type interaction
A two-way interaction (P < 0.001) (Table 5) between lighting type and muscle showed differences in tenderness in LL and PM steaks, which were more tender in LED displays (P < 0.05). Tenderness did not change (P > 0.05) based on display settings for GM. Colle et al (2015) showed similar results when comparing LL and GM muscles over extended aging periods, where results showed no observable differences in Warner-Bratzler shear force values for GM muscles across aging time points. Another study recognized collagen concentrations and sarcomere length in various beef muscles (Rhee et al., 2004), suggesting that while there were no differences in collagen content between GM, PM, and the Longissimus dorsi following 14 d of aging, the GM appeared to have shorter sarcomeres. While sarcomere length was not evaluated in the current study, the study by Rhee et al. (2004) explains a lack of tenderness changes in GM steaks during the entire display period.
Two-way interaction between lighting type and muscle type1 for significant2 flavor attributes
| Lighting Type and Muscle | ||||||||
|---|---|---|---|---|---|---|---|---|
| Light-Emitting Diode | Fluorescent | |||||||
| Attribute | GM | LL | PM | GM | LL | PM | SEM3 | P Value |
| Fat-like | 11.4c | 13.3a | 13.1ab | 11.9bc | 11.5c | 13.3a | 0.50 | <0.001 |
| Tenderness | 49.7d | 55.6c | 73.2a | 50.3d | 51.4d | 70.1b | 1.14 | <0.001 |
Gluteus medius (GM), Longissimus lumborum (LL), Psoas major (PM).
Significant attributes determined at P ≤ 0.05. Full list of attributes included beef flavor identity, brown/roasted, bloody/serumy, fat-like, liver-like, oxidized, umami, sweet, salty, bitter, sour, overall tenderness, and overall juiciness.
Standard error of the least-squares mean (largest).
Means within a row lacking a common superscript differ (P < 0.05).
Muscle type × display duration interaction
A third two-way interaction (P < 0.001) showed differences between muscle and display duration (Table 6). Liver-like flavor intensities increased (P < 0.05) following day 0 for all 3 muscles and continued to increase in intensity until day 10. The PM showed the greatest intensity (P < 0.05) by day 10, whereas LL had the lowest (P < 0.05) liver-like flavor intensity score by day 10. Sour flavor intensity for LL and PM were similar (P > 0.05) on day 0 and 2 but increased (P < 0.05) in both muscles beginning at day 6 and continued until day 10. The GM was similar (P > 0.05) in sourness flavor scores on day 0 and 10 but was lower (P < 0.05) at day 2 and 6. Sour flavors are commonly developed over time in vacuum-packaged beef owing to an accumulation of lactic acid bacteria (Pierson et al., 1970; Egan, 1983). Although the bacteria do not have harmful effects, they do add undesirable flavors. Furthermore, the GM and LL increased (P < 0.05) in tenderness over time, but PM remained the same (P > 0.05) over the entire aging period. Finally, umami intensities were similar in GM, LL, and PM steaks at day 0 and 2, but decreased (P < 0.05) in all 3 muscles beginning at day 6. By day 10, umami intensity for all 3 muscles was similar (P > 0.05).
Two-way interaction between muscle type and display duration for significant1 flavor attributes
| Muscle and Display Duration | ||||||||||||||
|---|---|---|---|---|---|---|---|---|---|---|---|---|---|---|
| GM | LL | PM | ||||||||||||
| Attribute | 0 d | 2 d | 6 d | 10 d | 0 d | 2 d | 6 d | 10 d | 0 d | 2 d | 6 d | 10 d | SEM2 | P Value |
| Buttery | 3.4c | 4.5bc | 3.5c | 5.2b | 4.6bc | 7.4a | 4.3bc | 5.1b | 4.5bc | 5.1b | 3.6c | 3.3c | 0.56 | <0.001 |
| Fat-like | 9.7d | 12.9abc | 11.6c | 12.5bc | 12.2bc | 14.4a | 11.4cd | 11.5cd | 11.9c | 14.6a | 13.9ab | 12.4bc | 0.69 | <0.001 |
| Liver-like | 5.9bcd | 7.5ab | 6.1bcd | 7.1abc | 2.5f | 3.2ef | 3.5ef | 4.7ed | 5.4cd | 7.8ab | 4.9de | 8.9a | 0.68 | <0.001 |
| Sour | 10.0bcd | 7.3def | 8.9bcde | 10.2bc | 7.2def | 5.3f | 7.6cde | 10.7b | 7.1def | 6.3ef | 8.4bcde | 14.4a | 1.10 | <0.001 |
| Tenderness | 44.3e | 51.1d | 49.0d | 55.6bc | 50.6d | 52.5cd | 52.0cd | 58.8b | 72.3a | 71.9a | 70.7a | 71.5a | 1.47 | <0.001 |
| Umami | 19.3ab | 18.0bcd | 14.6f | 14.4f | 16.9cde | 20.6a | 15.6ef | 15.7def | 16.9cde | 18.0bc | 16.1cdef | 14.6f | 0.89 | <0.001 |
Significant attributes determined at P ≤ 0.05 Full list of attributes included beef flavor identity, brown/roasted, bloody/serumy, fat-like, liver-like, oxidized, umami, sweet, salty, bitter, sour, overall tenderness, and overall juiciness.
Standard error of the least-squares mean (largest).
Means within a row lacking a common superscript differ (P < 0.05).
GM, Gluteus medius; LL, Longissimus lumborum; PM, Psoas major.
Volatile compound analysis
Of the compounds present in the samples evaluated (n = 56), many compounds (n = 46) were impacted by the interactions between treatments. Lipid oxidation–derived compounds and Maillard reaction–derived compounds were equally affected, with a majority being affected by muscle type or display duration (Tables 7–8).
Two-way interaction between muscle type and display duration for significant1 lipid-derived volatile flavor compounds
| Muscle Type and Display Duration | ||||||||||||||
|---|---|---|---|---|---|---|---|---|---|---|---|---|---|---|
| GM | LL | PM | ||||||||||||
| 0 d | 2 d | 6 d | 10 d | 0 d | 2 d | 6 d | 10 d | 0 d | 2 d | 6 d | 10 d | SEM2 | P Value | |
| Lipid-Derived Volatiles | ||||||||||||||
| Alcohols | ||||||||||||||
| 2,3-Butanediol | 11.36de | 25.75bcd | 32.65bc | 65.14a | 12.49de | 4.55e | 12.63de | 20.43cde | 20.11cde | 28.63bcd | 35.38bc | 41.67b | 9.75 | 0.016 |
| Ethanol | 35.81cd | 24.75cd | 31.77cd | 58.27b | 25.22cd | 37.88bcd | 27.76cd | 43.41bc | 18.32d | 19.11d | 28.84cd | 82.79a | 8.70 | 0.012 |
| n-Aldehydes | ||||||||||||||
| Butanal | 16.55bc | 14.99bc | 24.73a | 24.08a | 10.86c | 14.69bc | 14.51bc | 14.41bc | 19.05ab | 16.02bc | 16.82b | 23.82a | 2.19 | 0.019 |
| Esters | ||||||||||||||
| Butanoic acid, methyl ester | 0.73bc | 1.12ab | 0.67bc | 1.88a | 0.26c | 0.79bc | 1.10ab | 0.99bc | 0.79bc | 1.06bc | 1.89a | 1.01bc | 0.45 | 0.049 |
| Furans | ||||||||||||||
| 2-Pentyl furan | 0.75bcd | 0.60bcde | 1.05b | 0.56bcde | 1.67a | 0.79bc | 0.85bc | 0.94b | 0.19de | 0.30cde | 0.32cde | 0.11e | 0.22 | 0.032 |
| Ketones | ||||||||||||||
| 2-Butanone | 17.03b | 15.51b | 30.44a | 25.02a | 11.08b | 15.08b | 14.51b | 14.53b | 16.96b | 15.83b | 17.09b | 24.24a | 2.42 | 0.002 |
Significant compounds determined at P ≤ 0.05.
Standard error of the least-squares mean (largest).
Means within a row lacking a common superscript differ (P < 0.05).
GM, Gluteus medius; LL, Longissimus lumborum; PM, Psoas major.
Two-way interaction between muscle type and display duration for significant1 Maillard reaction–derived volatile flavor compounds
| Muscle Type and Display Duration | ||||||||||||||
|---|---|---|---|---|---|---|---|---|---|---|---|---|---|---|
| GM | LL | PM | ||||||||||||
| 0 d | 2 d | 6 d | 10 d | 0 d | 2 d | 6 d | 10 d | 0 d | 2 d | 6 d | 10 d | SEM2 | P Value | |
| Maillard Reaction Volatiles | ||||||||||||||
| Ketones | ||||||||||||||
| 3-hydroxy-2-butanone | 105.85abcd | 129.99ab | 171.95a | 56.76cde | 25.08e | 50.69cde | 45.86de | 71.33bcde | 74.17bcde | 112.24abc | 50.59cde | 21.79e | 34.63 | 0.022 |
| Pyrazines | ||||||||||||||
| 2,5-dimethylpyrazine | 0.60bcd | 0.52de | 0.83b | 1.18a | 0.35de | 0.79bc | 0.34de | 0.54cde | 0.34de | 0.28e | 0.49de | 0.47de | 0.15 | <0.001 |
| 2-ethyl-3,5/6-dimethylpyrazine | 0.24cd | 0.22d | 0.32abc | 0.58ab | 0.15d | 0.25cd | 0.52abc | 0.23cd | 0.12d | 0.51abc | 0.20d | 0.81a | 0.12 | 0.002 |
| Methyl-pyrazine | 0.27bc | 0.23cd | 0.35b | 0.49a | 0.14d | 0.26bc | 0.12d | 0.19cd | 0.17cd | 0.14d | 0.21cd | 0.19cd | 0.06 | <0.001 |
| Trimethylpyrazine | 0.32bc | 0.26bcd | 0.37b | 0.50a | 0.17de | 0.24cde | 0.21cde | 0.21cde | 0.18de | 0.15e | 0.20de | 0.16de | 0.04 | 0.013 |
| Strecker Aldehydes | ||||||||||||||
| 2-Methylbutanal | 2.05b | 1.51b | 3.91a | 5.08a | 1.37b | 1.14b | 1.43b | 1.97b | 1.43b | 1.31b | 2.06b | 2.24b | 0.69 | 0.014 |
| Benzaldehyde | 9.18abc | 8.99bc | 10.12ab | 10.59a | 6.81de | 7.25de | 6.53de | 5.59e | 6.15de | 5.89e | 5.68e | 7.67cd | 0.91 | 0.039 |
| Phenylacetaldehyde | 0.39c | 0.39c | 0.53b | 0.69a | 0.27def | 0.35cd | 0.33cde | 0.39c | 0.22f | 0.24ef | 0.28def | 0.38c | 0.04 | 0.009 |
| Sulfur Containing | ||||||||||||||
| Carbon disulfide | 39.64a | 20.04de | 21.46cd | 15.47de | 31.97ab | 27.96bc | 19.85de | 12.43e | 32.18ab | 17.65de | 19.85de | 21.27cd | 3.15 | 0.015 |
| Dimethyl-disulfide | 0.73bc | 1.12ab | 0.67bc | 1.88a | 0.26c | 0.78bc | 1.10ab | 0.99bc | 0.79bc | 1.06bc | 1.89a | 1.01bc | 0.45 | 0.050 |
Significant compounds determined at P ≤ 0.05.
Standard error of the least-squares mean (largest).
Means within a row lacking a common superscript differ (P < 0.05).
GM, Gluteus medius; LL, Longissimus lumborum; PM, Psoas major.
Lighting type × display duration interaction
An interaction (P ≤ 0.043) between lighting type and days of retail display (Table 9) affected ethyl benzene and 2,3-butanedione concentrations. Concentrations (nanograms/gram) of ethyl benzene, a lipid oxidation–derived compound responsible for cheese, olive oil, or roast beef flavors (Min et al., 1979; MacLeod and Ames, 1986), did not differ (P > 0.05) at day 0 under LED and FLUR light. The compound continued to increase under both lighting types in similar (P > 0.05) concentrations at day 2 and 6; however, at day 10, LED exhibited a substantially greater concentration (P < 0.05) of ethyl benzene. 2,3-Butanedione showed similar (P > 0.05) concentrations for both lighting types. However, day 10 in LED was the only sample exhibiting drastically reduced concentrations of the compound. The compound 2,3-butanedione is produced via lactic acid bacteria and the metabolism of sugars (Clark and Winter, 2015). However, studies have also shown that 2,3-butanedione may be impacted by amino acid content, as well fermentable sugars (Portno, 1965). As fermentation continues in the vacuum-packaged product with increased days of aging, 2,3-butanedione can be expected to remain at high concentrations. However, the decrease in concentration at day 10 for LED steaks may be explained with more research on the metabolic processes of lactic acid bacteria and other spoilage organisms. Studies such as Monostori et al. (2018) have shown metabolic differences in plants grown under LED and FLUR lighting, and brewers often battle impacts of light-sensitive compounds in beer (De Keukeleire et al., 2008) leading to further hypotheses of bacteria explaining the sharp decrease in concentration, given it is not the product of error in the method.
Two-way interaction between lighting type1 and display duration2 for significant3 volatile flavor compounds
| Lighting Type and Display Duration | ||||||||||
|---|---|---|---|---|---|---|---|---|---|---|
| LED | FLUR | |||||||||
| Compound | 0 d | 2 d | 6 d | 10 d | 0 d | 2 d | 6 d | 10 d | SEM4 | P Value |
| 2,3-Butanedione | 28.19abc | 35.75ab | 30.40ab | 17.70c | 27.08bc | 30.34ab | 38.99a | 33.64ab | 4.38 | 0.043 |
| Ethyl benzene | 0.16c | 0.71bc | 0.54bc | 2.27a | 0.13c | 0.42bc | 0.56bc | 0.88b | 0.33 | 0.006 |
Light-emitting diode (LED) and fluorescent (FLUR).
0 d, 2 d, 6 d, and 10 d.
Significant compounds determined at P ≤ 0.05.
Standard error of the least-squares mean (largest).
Means within a row lacking a common superscript differ (P < 0.05).
Lighting type × muscle type interaction
An interaction (P ≤ 0.046) between lighting type and muscle type was present for lipid-derived compounds, including 1-octanol, octanal, nonanoic acid, and tetradecane (Table 10). Shahidi and Pegg (1994) suggest that aldehydes are sensitive to oxidation and overly reactive. Because of this, lipid-derived compounds, specifically aldehydes and carboxylic acids, can be considered indicators of flavor deterioration. Furthermore, many of these compounds are related to fatty, rancid, or even sour notes (Burdock and Fenaroli, 2005), or producing undesirable cooked beef flavor, in the case of octanal (Um et al., 1992). Concentrations of 1-octanol—responsible for oily, sweet flavors (Burdock and Fenaroli, 2005)—were similar (P > 0.05) in GM and PM steaks exposed to FLUR lighting. Contrastingly, LL steaks exposed to LED showed the greatest (P < 0.05) amount of the compound across all muscle and lighting types. For the LL displayed under LED lighting, octanal—which is responsible for fatty flavors (MacLeod and Ames, 1986; Miller and Kerth, 2012)—appeared in greater concentrations (P < 0.05), whereas concentrations of octanal in the GM were greater (P < 0.05) under FLUR lighting and were the same (P > 0.05) as the LL under LED lighting. The PM, however, did not differ (P > 0.05) regardless of lighting type. Nonanoic acid, a carboxylic acid with a notable fruity aroma (Burdock and Fenaroli, 2005), was more present (P < 0.05) in LL under LED lighting than FLUR. The PM, on the other hand, showed the greatest (P < 0.05) concentrations of nonanoic acid of all steaks displayed under FLUR lighting. The GM, however, did not differ by lighting type (P > 0.05). Tetradecane concentrations did not differ (P > 0.05) in the PM, regardless of lighting type. However, concentrations were greatest (P < 0.05) in the LL under LED lighting and the GM under FLUR.
Two-way interaction between lighting type and muscle type1 for significant2 volatile flavor compounds
| Lighting Type and Muscle Type | |||||||||
|---|---|---|---|---|---|---|---|---|---|
| Light-Emitting Diode | Fluorescent | ||||||||
| Compound | GM | LL | PM | GM | LL | PM | SEM3 | P Value | |
| Lipid-Derived Volatiles | |||||||||
| Alcohols | |||||||||
| 1-Octanol | 1.34bc | 2.08a | 1.18bc | 1.64ab | 1.48bc | 1.06c | 0.20 | 0.046 | |
| n-Aldehydes | |||||||||
| Octanal | 10.25ab | 11.84a | 7.74c | 11.84a | 9.77b | 7.33c | 0.76 | 0.033 | |
| Carboxylic acids | |||||||||
| Nonanoic acid | 1.13b | 2.36a | 1.09b | 1.23b | 1.21b | 1.94ab | 0.37 | 0.018 | |
| Hydrocarbons | |||||||||
| Tetradecane | 0.69ab | 0.81a | 0.51b | 0.80a | 0.61b | 0.52b | 0.07 | 0.037 | |
Gluteus medius (GM), Longissimus lumborum (LL), Psoas major (PM).
Significant compounds determined at P ≤ 0.05.
Standard error of the least-squares mean (largest).
Means within a row lacking a common superscript differ (P < 0.05).
In a study conducted by Steele et al. (2016) analyzing the effect of LED lighting, thiobarbituric acid reactive substance values were evaluated in beef, pork, and turkey. This study noted greater concentrations of malondialdehyde (MDA) in products stored under LED lighting. According to the study, the levels of MDA present in highest abundance were still below a detectable limit perceived by consumers for lipid oxidation (Tarladgis et al., 1960; Steele et al., 2016). Nonetheless, those products stored under LED still exhibited greater concentrations of secondary lipid oxidation products than those displayed under FLUR lighting. Similarly, in the current study, off-flavors signifying lipid oxidation, such as oxidized, did not directly differ for any interactions when evaluated by trained descriptive panelists. However, the presence of lipid oxidation–derived volatile compounds may show lipid oxidation occurring under LED lighting while still remaining under a detectable threshold for flavor prevalence, as suggested by Tarladgis et al. (1960) and Steele et al. (2016). While these lipid-derived volatile compounds may not come from the contribution made by secondary lipid oxidation products like MDA, there is opportunity for primary oxidation products to aide in volatile production. Although primary products of lipid oxidation, such as hydroperoxides, are typically tasteless and odorless, their breakdown can yield volatile compounds which, in contrast, do produce recognizable tastes and smells (Gray and Monahan, 1992). Aroma makes up only a small portion of the perception of flavor, varying from person to person in detection and recognition thresholds (Keast and Roper, 2007; Webb et al., 2015). Similarly, while a combination of volatile compounds in one product may create undesirable flavors, the same combination in different quantities may create a desirable flavor profile in another, or even mask flavors that are actually present, as referenced by Marsili and Laskonis (2018) in studies of packaged food products. Within the current study, a combination of volatile compounds may be masking or masked by other combinations in greater concentrations, thus limiting the potential to detect oxidation by a trained panel.
Muscle type × display duration interaction
A third interaction (P ≤ 0.050) between muscle type and display duration showed the largest number of affected compounds (Table 7). Ethanol, commonly found in vacuum packaging because of lactic acid bacteria (Argyri et al., 2015), showed increased (P < 0.05) concentrations for GM, LL, and PM steaks across display duration as days of display increased. Additionally, 2,3-butanediol displayed dramatic increases (P < 0.05) in concentration over the 10-d display period across all muscle types. The GM exhibited the largest (P < 0.05) concentration of 2,3-butanediol at day 10, whereas LL showed the lowest. Both muscles, however, began day 0 with similar (P > 0.05) concentrations. 2,3-Butanediol is an alcohol produced during anaerobic metabolism during fermentation (Garg and Jain, 1995). Unsurprisingly, increases in both ethanol and 2,3-butandiol were seen over the 10-d display period, suggesting anaerobic fermentation within the packaging, which was to be expected for the packaging type.
The most notable differences for the interaction were seen in volatile compounds derived from the Maillard reaction (Table 8). An increase in Maillard reaction–derived compounds may occur because of an increase in free amino acid concentration during aging (Ginger et al., 1954; Nishimura et al., 1988; Foraker et al., 2020). These free amino acids are a constituent to the reaction itself. Furthermore, an increase (P < 0.05) in pyrazines, heterocyclic compounds contributing to roasted notes (Fay and Brevard, 2005; Legako, 2016), was seen across all muscle types over the 10-d aging period. Most notably, 2,5-dimethylpyrazine and methyl-pyrazine both increased (P < 0.05) in concentration in GM and LL steaks from day 0 to day 10. The PM, however, did not differ (P > 0.05) for either compound over the 10-d period. Trimethylpyrazine only showed increases (P < 0.05) in concentration in GM steaks at day 10, whereas LL and PM steaks did not differ (P > 0.05) over the display period. The Strecker aldehyde 2-methylbutanal only increased (P < 0.05) in GM steaks from day 0 to day 10. The LL and PM showed no difference (P > 0.05) in concentration for throughout the entirety of the display period. However, phenylacetaldehyde concentrations were similar (P > 0.05) on day 0 and 2 for GM, LL, and PM steaks. By day 6, concentrations increased (P < 0.05) for GM and PM, and by day 10, concentrations had increased (P < 0.05) for all muscle types. Compounds derived from Strecker degradation are important to signature beef aromas (Kerscher and Grosch, 1997). Finally, dimethyl-disulfide, a sulfur-containing compound, increased (P < 0.05) over the 10-d display period for all 3 muscles. In a study comparing volatile compounds in ground beef to spoilage organisms, dimethyl-disulfide was described as contributing to “decayed-vegetable” odors (Stutz et al., 1991). However, dimethyl-disulfide has also been considered a contributor to roasted attributes and may even be increased in pork when animals are fed vegetables like Brussel sprouts (Jensen et al., 2002). On the contrary, carbon disulfide decreased (P < 0.05) over the display period for all muscle types. The GM showed the greatest (P < 0.05) initial concentration of carbon disulfide at day 0, with similar (P > 0.05) values in the PM. However, concentrations of the compound decreased (P < 0.05) the least in the PM, which had the greatest (P < 0.05) concentrations at day 10.
Discriminant function analysis
A DFA was used to calculate functions to maximize variation between groups while minimizing the variation within groups. In doing so, variables that are highly correlated to each other are removed from the function in order to focus on those attributes that are less correlated. From a DFA, loadings and standardized coefficients were determined and provide the most insight to the discriminating variables. Models were developed within each fixed effect (lighting, duration, and muscle) to further extrapolate relationships among the most discriminating variables. Display duration and muscle were determined to vary among treatments (P < 0.001) within each respective DFA model. Lighting type did not vary (P = 0.212) within the developed DFA model.
Duration of display
Display duration differed across functions (Figure 1a–1b). Canonical correlations for retail age in the first discriminant function (DF1) accounted for 75.5% of variation between treatments (P < 0.001). The second discriminant function (DF2) explained 24.3% of variation (P < 0.001). Further functions were not significant (P > 0.05), thus explaining a majority (99%) of variation between treatments. DF1 was more effective at explaining variation than DF2. As shown in Figure 1a, DF1 maximally separated retail age day 10 from day 0. On the other hand, DF2 separated day 2 from day 0.
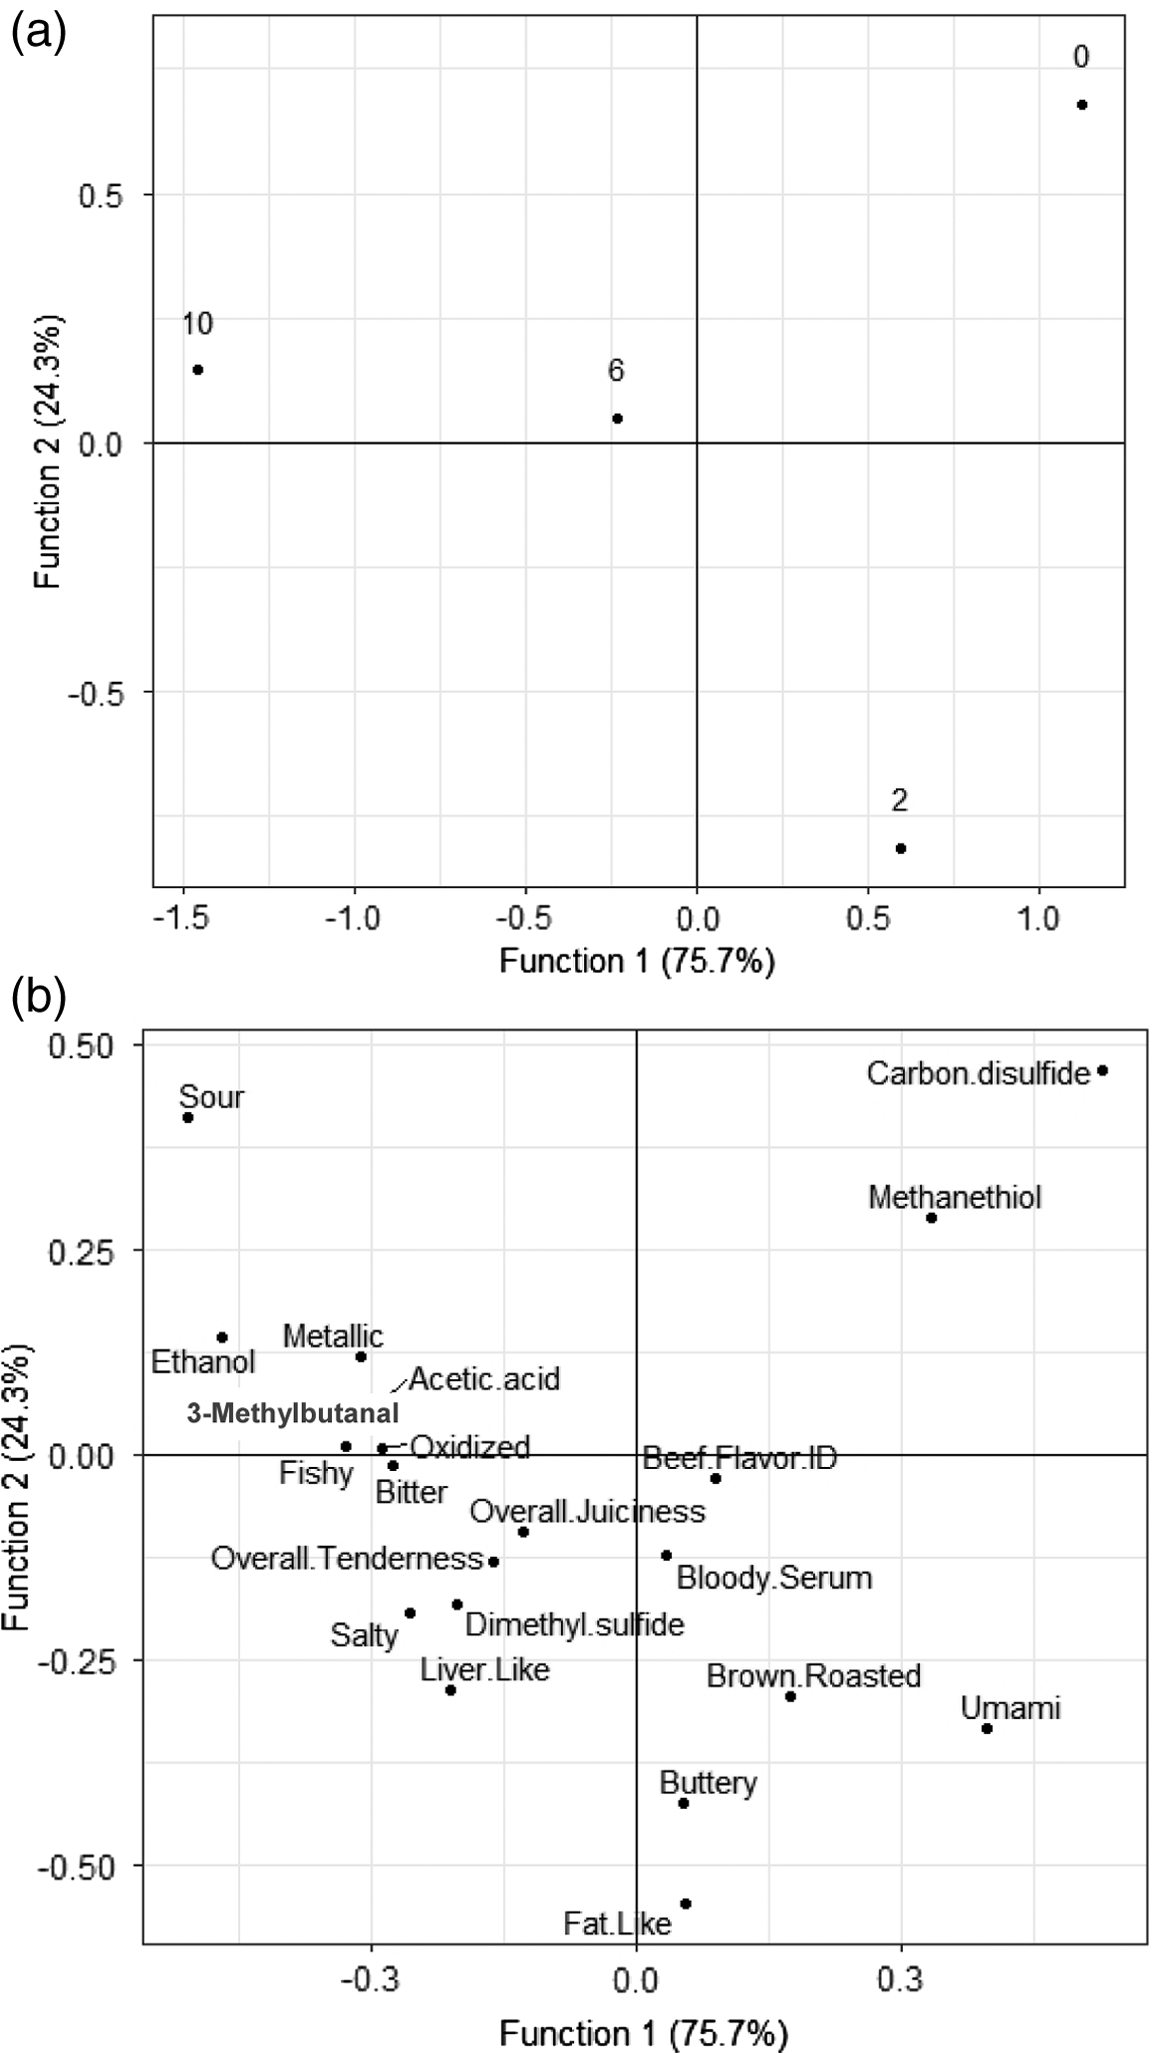
(a) Plot of display duration (0, 2, 6, and 10 d) on the first 2 discriminant functions derived from a combination of the ratings from trained sensory panels and volatile flavor compounds (P < 0.01). (b) Plot of loadings of sensory attributes and volatiles flavor compounds onto the first 2 discriminant functions.
The loadings on the DF1 function suggested off-flavors, such as oxidized, fishy, and bitter, weighed heavily on the function, while signature beef flavors like brown/roasted and umami contribute less to treatment separation. A greater number of volatile compounds associated with these off-flavors also loaded heavily on the side of the function representing the standardized coefficients day 6 and day 10. These compounds relating to the day 6 and 10 treatments were ethanol and acetic acid, which both may contribute to sour and acidic notes. 3-Methylbutanal is another compound that loaded heavily on the DF1 function in correlation with day 6 and day 10. The compound is responsible for browned, buttery, and nutty flavors in beef (O’Quinn et al., 2012) but is also found in greater concentrations with accumulation of free amino acids during aging of beef (Feidt et al., 1996), as elaborated on more recently by Gredell et al. (2018) and Foraker et al. (2020). Similarly, tenderness and juiciness are attributes that also loaded heavily on DF1, corresponding with the samples that received the longest display duration. The presence of negative attributes corresponding with these coefficients suggests that extending display periods in VRP may be detrimental at a certain length of time. Still, the Canonical correlations day 0 and day 2 are more related to positive attributes, bloody/serumy, brown/roasted, and beef flavor ID. Although less heavily loaded across the function, there are instances of negative attributes associated with the treatment types.
While the DF2 function accounted for a smaller percentage of variation within the model, the function displayed contrasting attributes, such as browned/roasted and sour, loading heaviest on opposite poles of the function. This variation is likely due to contrasting flavors and their dependence on the presence or absence of the other. While DF2 maximally separated day 0 and day 2, the Canonical correlations day 6 and day 10 are at the center of the majority of the flavors and volatile compound loadings on the function. Beef flavor ID, overall juiciness, and tenderness are the more positive attributes loading heavily on the function for those treatments at day 6 and day 10. Still, a greater concentration of negative attributes are more highly correlated with the extended days of display. The proximity of compounds such as ethanol and acetic acid to the day 10 treatment should be taken into consideration given prior studies noting the impact of vacuum packaging on the development of undesirable sour flavors (Seideman et al., 1976; O’Quinn et al., 2012). Despite the actual attribute of sour having less of an impact on the correlations, compounds like ethanol and acetic acid have been directly correlated with sour flavors as a product of lactic acid bacteria. Loadings between day 2 and day 6 are the most favorable attributes, buttery, umami, and brown/roasted, suggesting that the most successful retail display period is within this time frame. The maximally separated coefficient, day 0, showed the fewest attributes loading heavily on the function in correspondence: methanethiol, carbon disulfide, and sour. Prior research has shown that, as aging in vacuum packaging increases, so does the prevalence of off-flavors (Ba et al., 2012).
Muscle type
The DFA representing muscle type showed that Canonical correlations on DF1 explained (P < 0.001) 70% of the variation, whereas the DF2 accounted (P < 0.001) for 30% of the variation between treatments (Figure 2a–2b). The DF1 and DF2 functions explained 100% of the variation between treatments. DF1 was most effective at explaining variation, and maximally separated the PM from the GM and LL. Contrastingly, the DF2 function separated the GM and the LL. While the functions were evaluated as individuals, the intersection of DF1 and DF2 is noticeably skewed to the right.
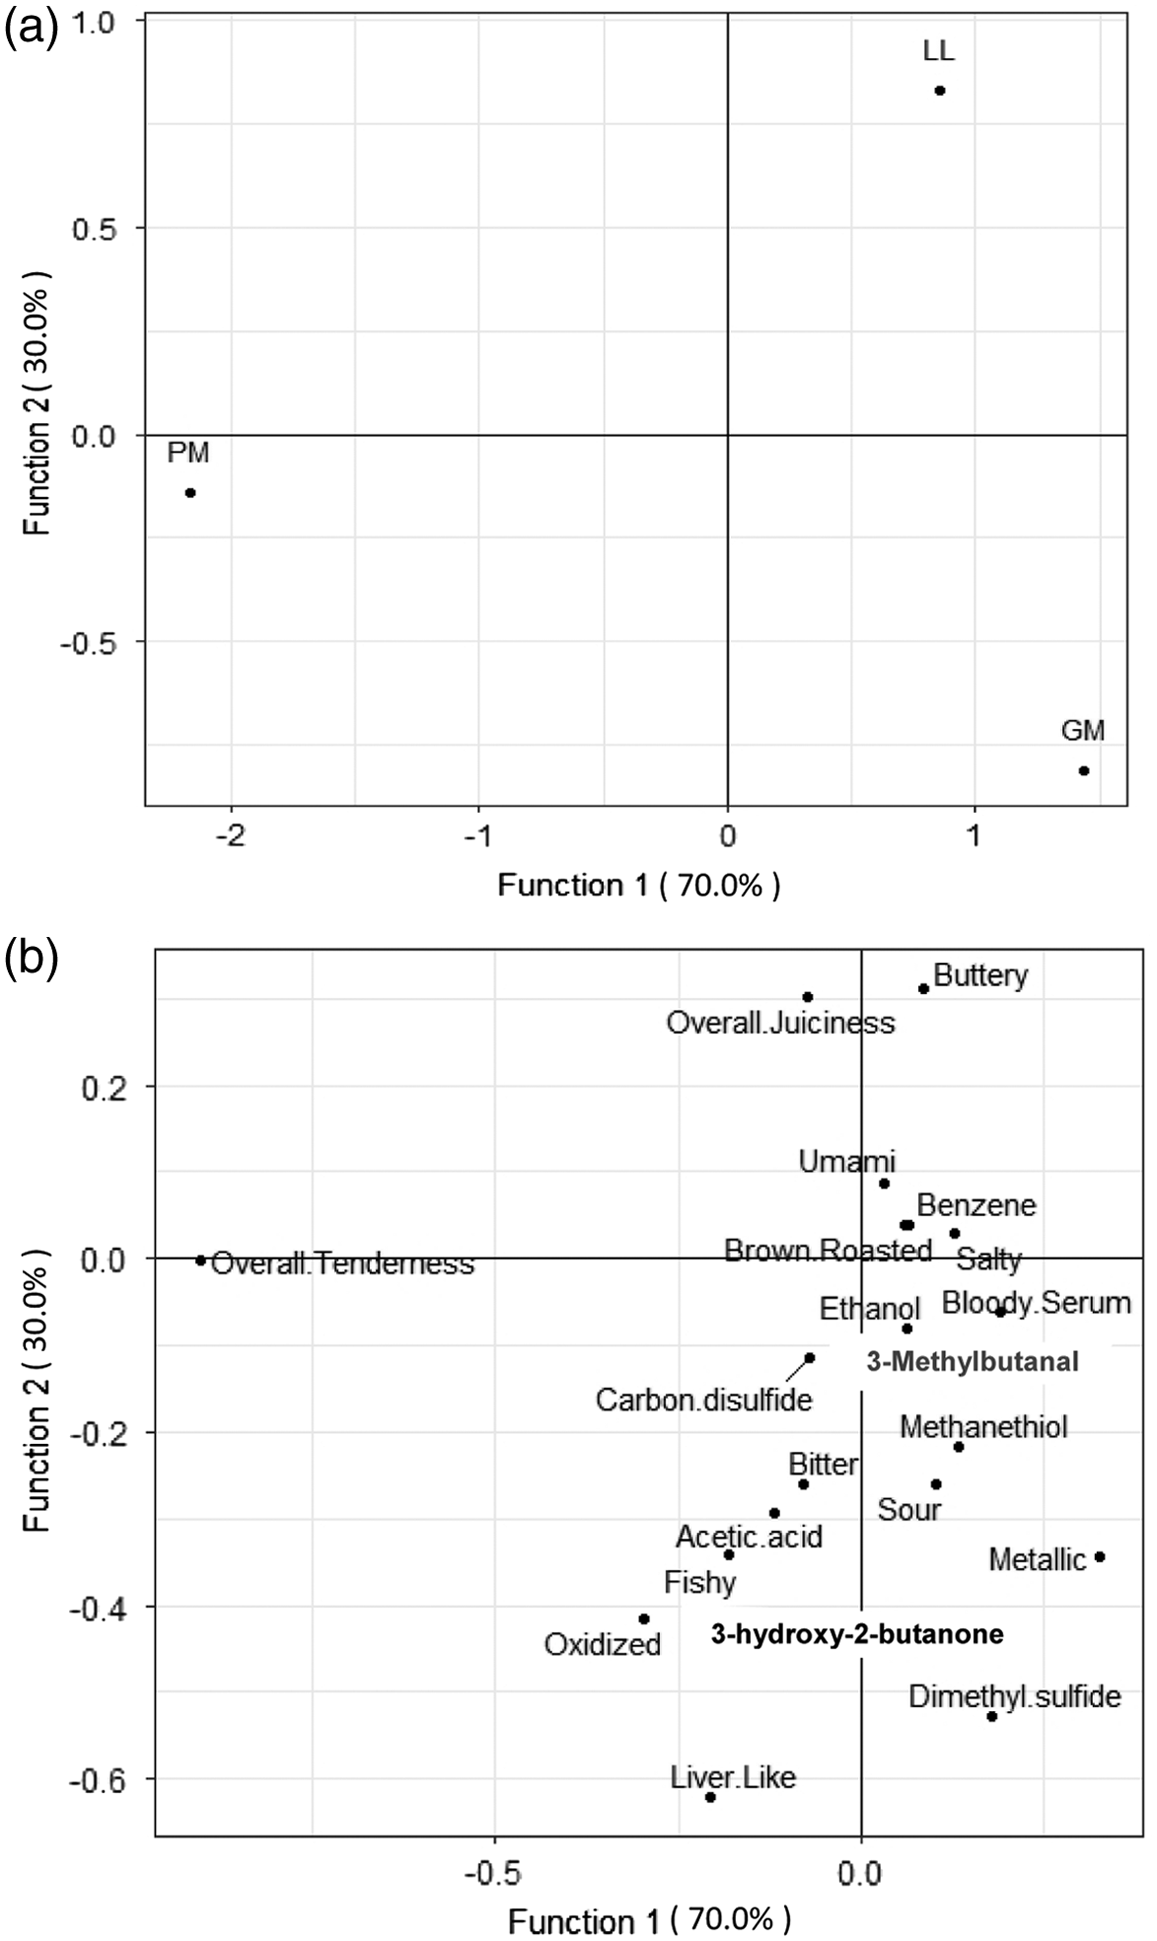
(a) Plot of muscle treatments (Gluteus medius [GM], Longissimus lumborum [LL], and Psoas major [PM]) on the first 2 discriminant functions derived from a combination of ratings from trained sensory panels and volatile flavor compounds (P < 0.01). (b) Plot of loadings of sensory attributes and volatile flavor compounds onto the first 2 discriminant functions.
While DF1 explained a higher percentage of variation between treatments, in general, a majority of the attributes and compounds displayed in the figure weighed similarly among the function. These attributes loaded heavily on the function where they corresponded with the LL and GM. The positive attributes brown roasted and bloody/serumy, as well as the compound 3-methybutanal, were heavily concentrated on the function. On the contrary, negative attributes such as liver-like, sour, and bitter were lighter loading on the DF1 function; however, they were still highly correlated with the side of the function representing the standardized coefficients LL and GM. Furthermore, compounds related to off-flavors, such as acetic acid, dimethyl sulfide, and methanethiol, loaded similarly on the function in correspondence with the standardized coefficients, although not as heavily. On the other hand, only one attribute corresponded with the PM: overall tenderness.
Contrastingly, the DF2 function shows the most widespread variation in loadings across the function. Positively associated attributes like beef flavor ID, umami, and browned/roasted weighed heaviest on the side corresponding the LL. On the opposite side, negative flavor attributes and compounds weighed heaviest where they corresponded with the Canonical correlation, GM. These off-flavors included liver-like, oxidized, metallic, and fishy. These flavors may also be associated with volatile compounds that loaded similarly. Dimethyl sulfide, a sulfurous compound, may contribute to signature cooked beef flavors (O’Quinn et al, 2012). Furthermore, acetic acid contributes to sour notes in beef. In the center of the function, corresponding to Canonical correlation, PM attributes such as overall tenderness, brown/roasted, and bloody/serumy are heavily loaded. Additionally, ethanol is a compound heavily loaded in correspondence with PM. Under anaerobic conditions, such as vacuum packaging, some bacteria become active and produce compounds like ethanol, providing sour flavors (Mayr et al., 2002). 3-Methylbutanal is another compound highly correlated with PM steaks, responsible for browned, roasty flavors (O’Quinn et al., 2012). The PM was centered on the function between LL and GM, showing the greatest mix of compounds and flavors which are considered both positive and negative.
Conclusion
These data show that LED lighting does not pose any detrimental effect on individually VRP beef steaks but, instead, produced results similar to those of FLUR lighting. While LED lighting appears to show improvements in certain beef attributes, such as increased tenderness and juiciness, greater concentrations of lipid oxidation–derived volatile compounds were also seen in those products displayed under LED sources. However, despite the presence of these volatile compounds, oxidized attributes and off-flavors related to oxidation were not evident to trained panelists, regardless of treatment. Therefore, detected differences in flavor chemistry may not be distinguishable for even trained descriptive panelists when specific attributes are more distinguishable than others, such as oxidized. Generally, direct exposure to light promotes the photooxidation process, resulting in flavors associated with rancidity; however, results of this study did not support that LED or FLUR light differed when individual beef steaks were packaged in VRP. These data did, however, show benefits of VRP and color maintenance. Despite exposure to different lighting sources for various periods, the visual appearance and numerical evaluation of displayed products did not show drastic change. Furthermore, the use of DFA provided a visual suggesting that the most successful retail display period was within 2 to 6 d. Overall, this study implies that at retail both VRP and newer LED lighting may be used successfully without appreciable detriment to beef quality.
Literature Cited
Adhikari, K., E. Chambers IV, R. Miller, L. Vaquez-Araujo, N. Bhumiratana, and C. Philip. 2011. Development of a lexicon for beef flavor in intact muscle. J. Sens. Stud. 26:413–420. doi: https://doi.org/10.1111/j.1745-459x.2011.00356.x.
AMSA. 2012. American Meat Science Association meat color measurement guidelines. Am. Meat Sci. Assoc. Champaign, IL.
AMSA. 2015. American Meat Science Association research guidelines for cookery, sensory evaluation, and instrumental tenderness measurements of meat. Version 1.0. Am. Meat Sci. Assoc. Champaign, IL.
Argyri, A. A., A. Mallouchos, E. Z. Panagou, and G. J. E. Nychas. 2015. The dynamics of the HS/SPME-GC/MS as a tool to assess the spoilage of minced beef stored under different packaging and temperature conditions. Int. J. Food Microbiol. 193:51–58. doi: https://doi.org/10.1016/j.ijfoodmicro.2014.09.020.
Ba, H. V., I. Hwang, D. Jeong, and A. Touseef. 2012. In: I. Akyard, editor, Principle of meat aroma flavors and future prospect. Intech Open, London, UK. doi: https://doi.org/10.5772/51110.
Bala, K., and H. D. Naumann. 1977. Effect of light on the color stability of sterile aqueous beef extract. J. Food. Sci. 42:563. doi: https://doi.org/10.1111/j.1365-2621.1977.tb01553.x.
Bell, R. G., N. Penney, K. V. Gilbert, S. M. Moorhead, and S. M. Scott. 1996. The chilled storage life and retail display performance of vacuum and carbon dioxide packed hot deboned beef striploins. Meat Sci. 42:371. doi: https://doi.org/10.1016/0309-1740(95)00057-7.
Brewer, S. 2007. The chemistry of beef flavor: Executive summary. Natl. Cattlemen’s Beef Assoc. 16. https://www.beefresearch.org/Media/BeefResearch/Docs/the_chemistry_of_beef_flavor_08-20-2020-98.pdf. (Accessed 1 March 2022).
Burdock, G. A., and G. Fenaroli. 2005. Fenaroli’s handbook of flavor ingredients. Fifth ed. CRC Press, Boca Raton, FL. doi: https://doi.org/10.1201/9781420037876.
Chail, A., J. F. Legako, L. R. Pitcher, R. E. Ward, S. Martini, and J. W. MacAdam. 2017. Consumer sensory evaluation and chemical composition of beef gluteus medius and triceps brachii steaks from cattle finished on forage or concentration diets. J. Anim. Sci. 95:1553–1564. doi: https://doi.org/10.2527/jas.2016.1150.
Clark, S., and C. K. Winter. 2015. Diacetyl in foods: A review of safety and sensory characteristics. Compr. Rev. Food Sci. F. 14:634–643. doi: https://doi.org/10.1111/1541-4337.12150.
Colle, M. J., R. P. Richard, K. M. Killinger, J. C. Bohlscheid, A. R. Gray, W. I. Loucks, R. N. Day, A. S. Cochran, J. A. Nasados, and M. E. Doumit. 2015. Influence of extended aging on beef quality characteristics and sensory perception of steaks from gluteus medius and longissimus lumborum. Meat Sci. 110:32–39. doi: https://doi.org/10.1016/j.meatsci.2015.06.013.
Dashdorj, D., T. Amna, and I. Hwang. 2015. Influence of specific taste-active components on meat flavor as affected by intrinsic and extrinsic factors: an overview. Eur. Food Res. Technol. 241. doi: https://doi.org/10.1007/s00217-015-2449-3.
De Keukeleire, D., A. Heyerick, K. Huvaere, L. H. Skibsted, and M. L. Andersen. 2008. Beer lightstruck flavor: The full story. Cerevisia. 33:133–144.
Dinh, T. T. N., K. Virellia To, and M. W. Schilling. 2021. Fatty acid composition of meat animals as flavor precursors. Meat Muscle Biol. 5:34, 1–16. doi: https://doi.org/10.22175/mmb.12251.
Dominguez, R., M. Pateiro, M. Gagaoua, F. J. Barba, W. Zhang, and J. M. Lorenzo. 2019. A comprehensive review of lipid oxidation in meat products. Antioxidants (Basel). 8:429. doi: https://doi.org/10.3390/antiox8100429.
Egan, A. F. 1983. Lactic acid bacteria of meat and meat products. Anton. Leeuw. Int. J. G. 49:327–336. doi: https://doi.org/10.1007/BF00399507.
Elmore, J. S., D. S. Mottram, M. Enser, and J. D. Wood. 1999. Effect of the polyunsaturated fatty acid composition of beef muscle on the profile of aroma volatiles. J. Agr. Food Chem. 47:1619–1625. doi: https://doi.org/10.1021/jf980718m.
Estévez, M., and C. Luna. 2017. Dietary protein oxidation: A silent threat to human health? Crit. Rev. Food Sci. 57:3781–3793. doi: https://doi.org/0.1080/10408398.2016.1165182.
Fay, L. B., and H. Brevard. 2005. Contribution of mass spectrometry to the study of the Maillard reaction in food. Mass Spectrom. Rev. 24:487–507. doi: https://doi.org/10.1002/mas.20028.
Feidt, C., A. Petit, F. Bruas-Reignier, and J. Brun-Bellut. 1996. Release of free amino-acids during ageing in bovine meat. Meat Sci. 44:19–25. doi: https://doi.org/10.1016/S0309-1740(96)00088-5.
Foraker, B. A., D. A. Gredell, J. F. Legako, R. D. Stevens, J. D. Tatum, K. E. Belk, and D. R. Woerner. 2020. Flavor, tenderness, and related chemical changes of aged beef strip loins. Meat Muscle Biol. 4:28, 1–18. doi: https://doi.org/10.22175/mmb.11115.
Gardner, K., and J. F. Legako. 2018. Volatile flavor compounds vary by beef product type and degree of doneness. J. Anim. Sci. 96:4238–4250. doi: https://doi.org/10.1093/jas/sky287.
Garg, S. K., and A. Jain. 1995. Fermentative production of 2,3-butanediol: A review. Bioresource Technol. 51:103–109. doi: https://doi.org/10.1016/0960-8524(94)00136-O.
Ginger, I. D., J. P. Wachter, D. M. Doty, B. S. Schweigert, F. J. Beard, J. C. Pierce, and O. G. Hankins. 1954. Effect of aging and cooking on the distribution of certain amino acids and nitrogen in beef muscle. J. Food Sci. 410–416.
Gray, J. I., and F. J. Monahan. 1992. Measurement of lipid oxidation in meat and meat products. Trends Food Sci. Tech. 3:315–319. doi: https://doi.org/10/1016/S0924-2244(10)80019-6.
Gredell, D. A., J. H. McHenry, D. R. Woerner, J. F. Legako, T. E. Engle, J. C. Brooks, J. D. Tatum, and K. E. Belk. 2018. Palatability characterization of fresh and dry-aged ground beef patties. Meat Muscle Biol. 2:265–276. doi: https://doi.org/10.22175/mmb2018.04.0007.
Hunt, M. R., J. F. Legako, T. T. N. Dinh, A. J. Garmyn, T. G. O’Quinn, C. H. Corbin, R. J. Rathman, J. C. Brooks, and M. F. Miller. 2016. Assessment of volatile compounds, neutral and polar lipid fatty acids of four beef muscles from USDA Choice and Select graded carcasses and their relationships with consumer palatability scores and intramuscular fat content. Meat Sci. 116:91–101. https://doi.orgj.meatsci.2016.02.010.
Jackson, T. C., G. R. Acuff, C. Vanderzant, T. R. Sharp, and J. W. Savell. 1992. Identification and evaluation of volatile compounds of vacuum and modified atmosphere packaged beef strip loins. Meat Sci. 31:175–190. doi: https://doi.org/10.1016/0309-1740(92)90037-5.
Jensen, M. T., L. L. Hansen, and H. J. Andersen. 2002. Transfer of the meat aroma precursors (dimethyl sulfide, dimethyl disulfide, and dimethyl trisulfide) from feed to cooked pork. Lebensm. Wiss. Technol. 35:485–489.
Joseph, P., S. P. Suman, G. Rentfrow, S. Li, and C. M. Beach. 2012. Proteomics of muscle-specific beef color stability. J. Agr. Food. Chem. 60:3196–3203. doi: https://doi.org/10/1021/jf204188v.
Keast, R., and J. Roper. 2007. A complex relationship among chemical concentration, detection threshold, and suprathreshold intensity of bitter compounds. Chem. Senses. 32:245–253. doi: https://doi.org/10.1093/chemse/bjl052.
Kerscher, R., and W. Grosch. 1997. Comparative evaluation of potent odorants of boiled beef by aroma extract dilution and concentration analysis. Eur. Food Res. Technol. 1997, 204, 3–6.
Kim, Y. H., E. Huff-Lonergan, J. G. Sebranek, and S. M. Lonergan. 2010. High-oxygen modified atmosphere packaging system induces lipid and myoglobin oxidation and protein polymerization. Meat Sci. 85:759–767. doi: https:// doi.org.10.1016/j.meatsci.2010.04.001.
Lanari, M. C., and R. G. Cassens. 1991. Mitchondrial activity and beef muscle color stability. J. Food Sci. 56:1476–1479. doi: https://doi.org/10.1111/j.1365-2621.1991.tb08619.x.
Legako, J. F. 2016. Elucidation of beef flavor character from flavor precursor compounds [White Paper]. Cattlemen’s Beef Board and National Cattlemen’s Beef Association, Centennial, CO.
Legako, J. F., J. C. Brooks, T. G. O’Quinn, T. D. J. Hagan, R. Polkinghorne, L. J. Farmer, and M. F. Miller. 2015. Consumer palatability scores and volatile beef flavor compounds of five USDA quality grades and four muscles. Meat Sci. 100:291–300. doi: https://doi.org/10.1016/j.meatsci.2014.10.026.
Lund, M. N., R. Lametsch, M. S. Hviid, O. N. Jensen, and L. H. Skibsted. 2007. High-oxygen packaging atmosphere influences protein oxidation and tenderness of porcine longissimus dorsi during chill storage. Meat Sci. 77:295–303. doi: https://doi.org/10.1016/j.meatsci.2007.03.016.
MacLeod, G., and J. M. Ames. 1986. The effect of heat on beef aroma: Comparisons of chemical composition and sensory properties. Flavour Frag. J. 1:91–104. doi: https://doi.org/10.1002/ffj.2730010302.
Marriott, N. G., H. D. Naumann, W. C. Stringer, and H. B. Hedrick. 1967. Color stability of prepackaged fresh beef as influenced by pre-display environments. Food Technol.-Chicago. 21:104.
Marsili, R. and C. Laskonis. 2018. Recognizing, detecting, and understanding the development of lipid oxidation off-flavors in foods and beverages. Current Investigations in Agriculture and Current Research 2:172–179. doi: https://doi.org/10.32474/CIACR.2018.02.000131.
Mayr, D., R. Margesin, F. Schinner, and T. D. Mark. 2002. Detection of the spoilage of meat using PTR-MS. Int. J. Mass Spectrom. 223– 224:229–235. doi: https://doi.org/10.1016/S1387-3806(02)00793-5.
McKerchar, H. J., S. Clerens, R. C. J. Dobson, J. M. Dyer, E. Maes, and J. A. Gerrard. 2019. Protein-protein crosslinking in food: Proteomic characterization methods, consequences, and applications. Trends Food Sci. Tech. 86:217–229. doi: https://doi.org/10.1016/j.tifs.2019.02.005.
Miller, R. K., and C. R. Kerth. 2012. Identification of compounds responsible for positive beef flavor. Final Report to National Cattlemen’s Beef Association. Meat Sci. 1–3.
Miller, R. K., C. R. Kerth, M. C. Berto, H. L. Laird, and J. W. Savell. 2019. Steak thickness, cook surface temperature and quality grade affected top loin steak consumer and descriptive sensory attributes. Meat Muscle Biol. 3:467–478. doi: https://doi.org/10.22175/mmb2018.07.0020.
Min, D. B. S., K. Ina, R. J. Peterson, and S. S. Chang. 1979. Preliminary identification of volatile flavor compounds in the neutral fraction of roast beef. J. Food Sci. 44:639–642. doi: https://doi.org/10/1111/j.1365-2621.1979.tb08465.x.
Monostori, I., M. Heilmann, G. Kocsy, M. Rakszegi, M. Ahres, S. B. Altenbach, G. Szalai, M. Pál, D. Toldi, L. Simon-Sarkadi, N. Harnos, G. Galiba, and E. Darko. 2018. LED lighting—Modification of growth, metabolism, yield and flour composition in wheat by spectral quality and intensity. Front. Plant Sci. 9:605. doi: https://doi.org/10.3389/fpls.2018.00605.
NAMP. 2014. The meat buyer’s guide. 8th ed. North American Meat Processors Association, Reston, VA.
Nishimura, T., M. R. Rhue, A. Okitani, and H. Kato. 1988. Components contributing to the improvement meat taste during storage. Agr. Biol. Chem. Tokyo. 52:2323–2330. doi: https://doi.org/10.1080/00021369.1988.10869028.
Nyquist, K. M., T. G. O’Quinn, L. N. Drey, L. W. Lucherk, J. C. Brooks, M. F. Miller, and J. F. Legako. 2018. Palatability of beef chucks, loin, and round muscles from three USDA quality grades. J. Anim. Sci. 96:4276–4292. doi: https://doi.org/10.1093/jas/sky305.
O’Keeffe, M., and D. E. Hood. 1982. Biochemical factors influencing metmyoglobin formation on beef from muscles of differing color stability. Meat Sci. 7:209–228. doi: https://doi.org/10.1016/0309-1740(82)90087-0.
O’Quinn, T. G., J. C. Brooks, R. J. Polkinghorne, A. J. Garmyn, B. J. Johnson, J. D. Starkey, R. J. Rathmann, and M. F. Miller. 2012. Consumer assessment of beef strip loin steaks of varying fat levels. J. Anim. Sci. 90:626–634. doi: https://doi.org/10.2527/jas.2011-4282.
Pierson, M. D., D. L. Collins-Thompson, and Z. J. Ordal. 1970. Microbiological, sensory and pigment changes of aerobically and anaerobically packaged beef. Food Technol.-Chicago 24:129–133.
Ponce, J. A., J. C. Brooks, and J. F. Legako. 2019. Chemical characterization and sensory relationships of beef M. longissimus lumborum and M. gluteus medius steaks after retail display in various packaging environments. Meat Muscle Biol. 44:27, 1–17. doi: https://doi.org/10.22175/mmb.10481.
Portno, A. D. 1965. Some factors affecting the concentration of diacetyl in beer. J. I. Brewing 72:193–196.
Rhee, M. S., T. L. Wheeler, S. D. Shackelford, and M. Koohmaraie. 2004. Variation in palatability and biochemical traits within and among eleven beef muscles. J. Anim. Sci. 82:534–550. doi: https://doi.org/10.2527/2004.822534x.
Seideman, S. C., and P. R. Durland. 1983. Vacuum packaging of fresh beef: A review. J. Food Quality 6:29–47. doi: https://doi.org.10.1111/j.1745-4557.1983.tb00755.x.
Seideman, S. C., C. Vanderzant, G. C. Smith, M. O. Hanna, and Z. L. Carpenter. 1976. Effect of degree of vacuum and length of storage on the microflora of vacuum packaged beef wholesale cuts. J. Food Sci. 41:738–742. doi: https://doi.org/10.1111/j.1365-2621.1976.tb00715_41_4.x.
Shahidi, F. and R. B. Pegg. 1994. Hexanal as an indicator of meat flavor deterioration. J. Food Lipids. 1:177–186. doi: https://doi.org/10.1111/j.1745-4522.1994.tb00245.x.
Sitz, B. M., C. R. Calkins, D. M. Feuz, W. J. Umberger, and K. M. Eskridge. 2006. Consumer sensory acceptance and value of wet-aged and dry-aged beef steaks. J. Anim. Sci. 84:1221–1226. doi: https://doi.org/10.2527/2006.8451221x.
St. Angelo, A. J., J. R. Vercellotti, M. G. Legendre, C. H. Vinnett, J. W. Kuan, C. James Jr., and H. P. Dupuy Jr. 1987. Chemical and instrumental analysis of warmed-over flavor in beef. J. Food Sci. 52:1163–1168.
Steele, K. S., M. J. Weber, E. A. E. Boyle, M. C. Hunt, A. S. Lobaton-Sulabo, C. Cundith, Y. H. Hiebert, K. A. Abrolat, J. M. Attey, S. D. Clark, D. E. Johnson, and T. L. Roenbaugh. 2016. Shelf life of fresh meat products under LED or fluorescent lighting. J. Meat Sci. 117:75–84. https://doi.org.10.1016/j.meatsci.2016.02.032.
Stutz, H. K., G. J. Silverman, P. Angelini, and R. E. Levin. 1991. Bacteria and volatile compounds associated with ground beef spoilage. J. Food Sci. 56:1147–1153. doi: https://doi.org/10.1111.j.1365-2621.1991.tb04721.x.
Tarladgis, B. G., B. M. Watts, M. T. Younathan, and L. Dugan. 1960. A distillation method for the quantitative determination of malonaldehyde in rancid foods. J. Am. Oil Chem. Soc. 37:44–48. doi: https://doi.org/10.1007/BF02630824.
Um, K. W., M. E. Bailey, A. D. Clarke, and R. R. Chao. 1992. Concentration and identification of volatile compounds from heated beef fat using supercritical carbon dioxide extraction gas liquid chromatography/mass spectrometry. J. Agr. Food Chem. 40:1641–1646. doi: https://doi.org/10.1021/JF00021A033.
Vierck, K. R., J. F. Legako, J. K. Kim, B. J. Johnson, and J. C. Brooks. 2020. Determination of package and muscle-type influence on proteolysis, beef-flavor-contributing free amino acids, final beef flavor, and tenderness. Meat Muscle Biol. 4:26, 1–14. doi: https://doi.org/10.22175/mmb.10933.
Webb, J., D. P. Bolhuis, S. Cicerale, J. E. Hayes, and R. Keast. 2015. The relationships between common measurements of taste function. Chemosens. Percept. 8:11–18. doi: https://doi.org/10.1007/s12078-015-9183-x.