
Introduction
Few and mostly inconclusive studies have been carried out to study the effects of the timing and duration of low-voltage electrical stimulation (LVES) on carcass and meat quality of bovine carcasses from feedlot cattle of different sizes. As reported by Savell (2012), carcass size and live weight have increased in recent times due to a range of factors, among which is the use of beta-agonists such as zilpaterol hydrochloride to improve feed efficiency, muscle mass, and carcass yield (Fiems, 1987). Savell (2012) reported that carcass weights have increased over time, on average by 1 to 1.5 kg each year, while Vasconcelos et al. (2008) reported about 15 kg increase in carcass weight when cattle were fed with zilpaterol hydrochloride. Currently in South Africa, a large portion of feedlot cattle are supplemented with zilpaterol hydrochloride in the feed. The challenge is that these carcasses are processed in facilities that were designed to accommodate smaller carcasses over the years, and there are concerns that quality may be affected due to increased size of the carcasses. Calnan et al. (2014) reported that lambs of higher growth rate with heavier muscles and carcass weight produced loins with better reflectance (R630/R580) after 3 d of simulated display. Also, McGilchrist et al. (2012) found a low incidence of dark-cutting meat in large carcasses with large eye muscle area and increased subcutaneous fat depth. Thompson (2002) also reported that, according to Meat Standards Australia audits, heavier carcasses require less electrical stimulation (ES) to achieve a similar glycolytic rate as the smaller carcasses, which was why LVES was considered for this experiment.
Meat color is one of the most important attributes that influence consumers’ decision to buy meat, and consumers use the degree of discoloration as a measure of freshness and wholesomeness when buying meat (Mancini and Hunt, 2005). According to Smith et al. (2000), about 15% of retailed meats are passed over by consumers due to color defects. Most consumers prefer the bright, cherry-red beef that is neither too pale nor dark (Killinger et al., 2004). Regarding the effects of energy metabolites on meat color, it is known that the energy status of meat immediately postmortem affects the color and tenderness (Monin and Sellier, 1985). The common energy metabolites that come into play postmortem are glycogen, glucose, glucose-6-phosphate (G6P), adenosine triphosphate (ATP), creatine phosphate (CP), and lactate. The interactions between these metabolites through the process of glycolysis, which is known to be affected by ES, brings about the formation of lactic acid, which contributes greatly to pH decline (Hwang et al., 2003). A common term used to describe the reaction of these metabolites is called glycolytic potential (GP), which is used to estimate the ability of muscle to generate lactic acid (Hanson and Calkins, 2001). Wulf et al. (2002) relate higher GP to increased tenderness and low GP to the Dark, Firm, and Dry condition, which affects the color and palatability of meat. According to Pethick et al. (1999), when preslaughter level of glycogen falls below the critical threshold of 57 mmol/g, the normal ultimate meat pH (5.5–5.6) (Tarrant, 1989) will not be attained, and this affects meat color (dark, firm, and dry condition).
Another major factor that affects beef color is ES, but the extent of color change depends on the pH–temperature relationship, ES intensity (Mareko, 2000), and the type of muscle observed (Ledward, 1985). ES is known to bring about faster glycolysis to enhance meat color and color stability and to produce paler color in meat (Sleper et al., 1983; Ledward et al., 1986). This is attributed to protein denaturation and myofibrillar lattice shrinkage (Offer and Trinick, 1983). Some researchers have shown that ES-treated meat accumulates less metmyoglobin (Renerre, 1984) and displays a more appealing, lighter bright-red color (Eikelenboom et al., 1985; Smith, 1985). LVES is considered less risky and cheaper to use compared to high-voltage ES (Fabianson and Laser Reutersward, 1985). Studies have also shown that LVES is as equally effective as high-voltage ES in the acceleration of glycolysis and enhancement of meat color and tenderness (Aalhus et al., 1994). However, negative effects of LVES on meat color have been reported by some authors (Unruh et al., 1986). In addition, it has been shown that LVES is more effective when applied early postmortem (Chrystall et al., 1980; Polidori et al., 1999), rather than later (Hwang and Thompson, 2001a). According to the report by Meat and Livestock Australia and the Australian Meat Processors Corporation (MLA and AMPC, 2011), ES immediately after slaughter enhances bleed-out and brings about lighter and redder meat. The duration of ES that could lead to over- or understimulation also plays a crucial role in optimizing qualities of meat such as color, drip loss, and tenderness (Hildrum et al., 1999). According to Hwang et al. (2003), prolonged stimulation could lead to excessive glycolysis resulting in paler color due to faster pH decline. Other authors have suggested that the rapid pH decline at higher carcass temperatures, especially in heavy carcasses, causes more protein denaturation, which results in less color stability (Sammel et al., 2002a).
Currently, in South Africa, zilpaterol hyrochloride is routinely used, and therefore ES is necessary to counter the consequent meat toughness and speed up glycolytic activities to chill the carcasses faster. Unfortunately, there is wide variation in the use of ES, and there is no uniform protocol, which brings about discrepancies in carcass and meat quality. A large proportion of abattoirs still use either the high- or medium-voltage stimulation, which presents the risk of overstimulation leading to high drip loss, pale, soft and exudative meat, and other negative meat quality characteristics. Because of this situation, the objective of this study was to evaluate the effects of LVES, in terms of duration and timing of stimulation, on meat energy metabolites, color, and the relationship between these attributes in light and heavy carcasses from South African feedlot cattle. The second objective was to predict color and color stability concerning other attributes at the abattoir/during butchery period (2 d postmortem) and retail display period (14 d postmortem) using a regression model that includes likely causal factors such as muscle pH, temperature, and energy metabolites early postmortem.
Materials and Methods
Materials and preslaughter processes
The trial was conducted at a high throughput commercial abattoir located in the Free State province of South Africa. The abattoir is registered with the Red Meat Abattoir Association and International Meat Quality Assurance Services and is certified by the International Organization for Standardization, Food Safety System Certification (22000, 14001, 9001) and Occupational Health and Safety (18001). Ethical clearance was approved by the Animal Care and Use Committee of the University of Pretoria. The animals comprised Bonsmara-type crosses that represent typical South African feedlot cattle. Animals were reared and weaned on a farm for about 7 to 8 mo prior to their transfer to a feedlot where they were fed a commercial feedlot ration (10.5 MJ/Metabolizable Energy kg−1 dry matter), available ad libitum, for about 3 to 4 mo before slaughter at, on average, 12 months of age. The feed of the animals was supplemented with zilpaterol hydrochloride (0.15 mg/kg live weight) 1 mo before slaughter followed by a 3-d withdrawal period according to the current industry practice (Hope-Jones et al., 2010). One hundred and forty-seven steers in the “A” age group (with no permanent incisors, aged ± 12 mo old) were studied. Fatness scores ranged between 2 and 3 (lean to medium) according to the South African Beef Carcass Classification System (Meat Classification Regulation No. 863 in Government Gazzette, September 2006). The average subcutaneous fat on the 12/13 rib (after carcass splitting) of the small carcasses (≤ 260 kg, with average weight of 242 kg) was 3.59 mm, whereas that of the heavy carcasses (≥ 290 kg, with average weight of 321 kg) was 6.50 mm. Animals were transported at night by truck for 2 h (100 km) to the abattoir with approximately 6 h of lairage time, with access to water but without feed. Animals were slaughtered in groups of about 20 animals per treatment group over 5 wk conventionally and humanely according to standard commercial procedure (Agbeniga and Webb, 2012).
Postslaughter processes and methods
After slaughter, each carcass was suspended by a shackle on one hind leg while bleeding. Early stimulation (before evisceration) was done 7 min postmortem (during bleeding, which lasted for about 8 min), whereas late stimulation (after evisceration) was done about 45 min postmortem, after dressing, at the grading area, and after splitting the carcasses about 37 min postmortem. The setting of the stimulator (Jarvis Product Corporations, South Africa, PTY LTD, Middletown, CT) was as follows: voltage = 110 V, frequency = 17 Hz, pulse = 5 m/s, and an alternating current of 1 A. Stimulation was done by hooking the sharp positive end of the electrode on the cut neck region while the electric current ran through, and the negative electrode (earth) was connected to the rail line. After evisceration, all carcasses were moved to a chiller room at ±2°C with air speed of about 1.5 m/s2 at relative humidity of 95%, at about 1 h postmortem. The nonstimulated control sides were chilled in the same chillers as the electrically stimulated ones.
Prior to slaughter, the live weight of each animal was recorded at the abattoir, to estimate and group the carcass sides in small and heavy weights. For the small carcasses, the minimum carcass weight was 200 kg (100 kg side), whereas for the heavy carcasses, the maximum carcass weight was 350 kg (175 kg side). Carcasses were also grouped based on the time of stimulation (i.e., before evisceration at 3 min postmortem and after evisceration at 45 min postmortem) and the duration of stimulation (30 or 60 s), whereas the nonstimulated controls were only grouped into light and heavy carcass sides. The different combination of these treatments, i.e., carcass weight, ES time, and ES duration, made up the 10 treatment groups in this trial. Treatment groups were evaluated for meat color (L*, a*, and b*) at 2 and 14 d postmortem, while energy metabolites (glycogen, glucose, G6P, lactate, ATP, and CP) were evaluated on the same longissimus et lumborum (LL) samples at 1, 4, and 24 h postmortem. The experimental design is presented in Table 1.
Treatment groups
| Group 1(n = 18) | Group 2(n = 15 | Group 3(n = 16) | Group 4(n = 16) | Group 5(n = 14) | Group 6(n = 15) | Group 7(n = 13) | Group 8(n = 11) | Group 9(n = 14) | Group 10(n = 15) | |
|---|---|---|---|---|---|---|---|---|---|---|
| Abbreviation | SnesC | HnesC | Ses30B | Ses60B | Ses30A | Ses60A | Hes30B | Hes60B | Hes30A | Hes60A |
| CW | S | H | S | S | S | S | H | H | H | H |
| ES d | NES | NES | ES 30s | ES 60s | ES 30s | ES 60s | ES 30s | ES 60s | ES 30s | ES 60s |
| ES t | Control | Control | B | B | A | A | B | B | A | A |
A = late stimulation; B = early stimulation; CW = carcass weight; ES 30s = stimulation for 30 s; ES 60s = stimulation for 60 s; ES d = ES duration; ES t = time of stimulation; H = heavy carcasses (≥ 290 kg); Hes30A = heavy carcasses, electrically stimulated for 30 s, after evisceration or late stimulation; Hes30B = heavy carcasses, electrically stimulated for 30 s, before evisceration or early stimulation; Hes60A = heavy carcasses, stimulated for 60 s, after evisceration or late stimulation; Hes60B = heavy carcasses, electrically stimulated for 60 s, before evisceration or early stimulation; HnesC = heavy carcasses, non-electrically stimulated controls; NES = non-electrically stimulated; S = small carcasses (≤ 260 kg); Ses30A = small carcasses, electrically stimulated for 30 s, after evisceration or late stimulation; Ses30B = small carcasses, electrically stimulated for 30 s, before evisceration or early stimulation; Ses60A = small carcasses, electrically stimulated for 60 s, after evisceration or late stimulation; Ses60B = small carcasses, electrically stimulated for 60 s, before evisceration or early stimulation; SnesC = small carcasses, non-electrically stimulated controls.
Carcass pH and temperature was measured by a portable pH meter fitted with a temperature probe (Oakton Instrument [Vermon Hills, IL 60061]; RS 232, 2003 model) at 45 min, 3 h, 6 h, 12 h, and 24 h postmortem. The pH glass electrode and the temperature probe were inserted into an incision (approximately 2 cm deep) on the LL (12th–13th ribs). About 500 g of LL sample was dissected from the left side of each carcass between the 11th and 13th ribs after the 24-h pH and temperature readings. These samples were packed in vacuum bags and kept at 4°C until analysis at 2 and 14 d postmortem. The meat color attributes were measured with a Minolta meter (Model CR200, with 8 mm diameter; Konica Minolta, Osaka, Japan) on fresh samples at 48 h and 14 d postmortem. Fresh cut steaks about 1.5 cm thick from the dissected samples (LL) were allowed to bloom for 1 h at a temperature of 4°C before readings were taken. The color attributes that were recorded are lightness, L* value (dark to light), a* value (green to red), and b* value (blue to yellow) (CIE, 1986). The physiological attribute of chroma (C*), which is the intensity of the red color (saturation index), was calculated as (a*2 + b*2)1/2 (MacDougall, 1977), and the hue angle (H*) (discoloration) was calculated as tan−1 (b*/a*) (Young et al., 1999). The values of the attributes were recorded with spectral component excluded, and D65 lamp was used for our analysis.
Glucose and glycogen concentration in the muscle were determined using the modified method of Dalrymple and Hamm (1973) as described by Keepler and Decker (1974); 2 g of muscle sample was homogenized in 10 mL 0.6 N perchloric acid. Muscle lactate concentration was also determined using the modified method of Dalrymple and Hamm (1973) as described by Gutmann and Wahlfeld (1974). Two grams of muscle was homogenized in 10 mL 0.6 N perchloric acid. Lastly, G6P, ATP, and CP concentration in the muscle were determined by the modified method of Dalrymple and Hamm (1973) as described by Bernt et al. (1974). According to van Laack and Kauffman (1999), GP = 2 × (glucose + glycogen + G6P) + lactate.
Statistical analysis
General linear model (SAS version 9.3, SAS Institute Inc., Cary, NC) was used to compare the variation between the mean values of the treatment groups. Pairwise comparison was used to rank and to compare (in order of magnitude) the means of the treatment groups to determine significant differences. For meat color and energy metabolites, analysis of variance was used to determine the variance contrast at 2 and 14 d and at 1, 4, and 24 h postmortem of measurements, respectively. The main effects, their interactions, and significance were determined using multivariate test and test of between-subject effects. Means were separated and compared using Fisher’s protected least significant difference at 5% level of probability (Snedecor and Cochran, 1980). Correlation analyses were done using the CORR procedure to determine the relationship between all the measured carcass and meat quality attributes. Regression analysis was performed using the model y = β0+β1x1 + β2x2 + β3x3+β4x4 + β5x5 + β6x6 + β7x7 + β8x8 + β9x9 + β10x10 where y is the dependent variable (e.g., chroma), β0 is the intercept (overall mean value of y), and x1to x9 are the dummy variables associated with the 10 treatments.
Results
A summary of the effects of the experimental treatments on pH and temperature readings is presented in Table 2.
pH and temperature readings (mean ± SD) for treatment groups at 45 min, 3 h, 6 h, 12 h, and 24 h postmortem
| Treatment | pH 45 min Mean ± SD | T 45 min Mean ± SD | pH 3h Mean ± SD | T 3 h Mean ± SD | pH 6 h Mean ± SD | T 6 h Mean ± SD | pH 12 h Mean ± SD | T 12 h Mean ± SD | pH 24 h Mean ± SD | T 24 h Mean ± SD |
|---|---|---|---|---|---|---|---|---|---|---|
| 1. S NES | 6.51 ± 0.2d | 35.5 ± 1.6e | 6.35 ± 0.3b | 25.5 ± 2.2cd | 6.13 ± 0.2a | 17.4 ± 1.8b | 5.81 ± 0.2ab | 6.7 ± 1.3f | 5.56 ± 0.1bc | 3.2 ± 0.3e |
| 2. H NES | 6.55 ± 0.2cd | 35.2 ± 2.0e | 6.40 ± 0.3ab | 26.4 ± 3.0c | 6.13 ± 0.2a | 19.5 ± 2.8a | 5.73 ± 0.2b | 7.8 ± 1.7cde | 5.48 ± 0.1cd | 3.4 ± 0.4de |
| 3. S 30 B | 6.15 ± 0.3e | 38.8 ± 0.9cd | 5.81 ± 0.3c | 23.8 ± 2.3de | 5.66 ± 0.3b | 14.6 ± 1.8c | 5.59 ± 0.2c | 7.3 ± 1.0def | 5.49 ± 0.2cd | 3.1 ± 0.4e |
| 4. S 60 B | 5.94 ± 0.3f | 38.9 ± 1.2cd | 5.70 ± 0.2c | 24.8 ± 2.1cd | 5.64 ± 0.3b | 15.2 ± 1.1c | 5.51 ± 0.1c | 8.3 ± 0.9cd | 5.47 ± 0.1d | 3.8 ± 0.3de |
| 5. S 30 A | 6.84 ± 0.2ab | 37.9 ± 1.6d | 6.37 ± 0.3b | 26.7 ± 2.8c | 6.08 ± 0.3a | 14.6 ± 2.7c | 5.91 ± 0.2a | 7.0 ± 1.4ef | 5.65 ± 0.1a | 3.3 ± 0.4e |
| 6. S 60 A | 6.89 ± 0.2a | 38.9 ± 0.6cd | 6.57 ± 0.3a | 31.1 ± 2.8b | 6.08 ± 0.2a | 15.8 ± 2.0c | 5.91 ± 0.2a | 8.6 ± 0.7bc | 5.64 ± 0.1ab | 3.8 ± 0.4cd |
| 7. H 30 B | 6.06 ± 0.2ef | 39.8 ± 0.6ab | 5.69 ± 0.2c | 22.5 ± 2.6e | 5.58 ± 0.2b | 18.5 ± 2.0ab | 5.48 ± 0.1c | 9.7 ± 1.1a | 5.46 ± 0.1d | 4.0 ± 0.5bc |
| 8. H 60 B | 5.94 ± 0.2f | 40.5 ± 0.6a | 5.65 ± 0.2c | 26.7 ± 3.0c | 5.56 ± 0.1b | 19.0 ± 3.7ab | 5.51 ± 0.1c | 9.6 ± 1.4ab | 5.46 ± 0.1d | 3.7 ± 0.7cd |
| 9. H 30 A | 6.84 ± 0.2ab | 39.6 ± 0.6bc | 6.31 ± 0.3b | 34.0 ± 3.8a | 5.97 ± 0.3a | 17.5 ± 1.8b | 5.81 ± 0.2ab | 9.8 ± 1.9a | 5.71 ± 0.1a | 4.6 ± 1.1a |
| 10. H 60 A | 6.69 ± 0.2bc | 39.2 ± 0.9bc | 6.31 ± 0.3b | 34.4 ± 3.8a | 6.03 ± 0.3a | 17.6 ± 2.1b | 5.77 ± 0.2b | 9.6 ± 2.3ab | 5.64 ± 0.2ab | 4.3 ± 0.9ab |
Means in the same column without common superscript letters differ (P < 0.05).
30 = 30-s stimulation; 60 = 60-s stimulation; A = late stimulation; B = early stimulation; H = heavy carcasses; NES = nonstimulated; S = small carcasses; SD = standard deviation; T = temperature.
Early ES resulted in faster pH decline, whereas late ES and nonstimulated control had a slower pH decline from 45 min to 24 h postmortem. There were significant differences (P < 0.05) between the ultimate pH (pHu) of the early stimulated (Groups 3, 4, 7, and 8) and late stimulated (Groups 5, 6, 9, and 10) groups. Regarding temperature decline, carcasses in the heavy groups (Groups 2, 7, 8, 9, and 10) had the slowest (P < 0.05) decline at the different measuring times compared to the lighter groups, as expected. Figures 1, 2, and 3 show the average L*, chroma, and hue values at 2 and 14 d postmortem, respectively.
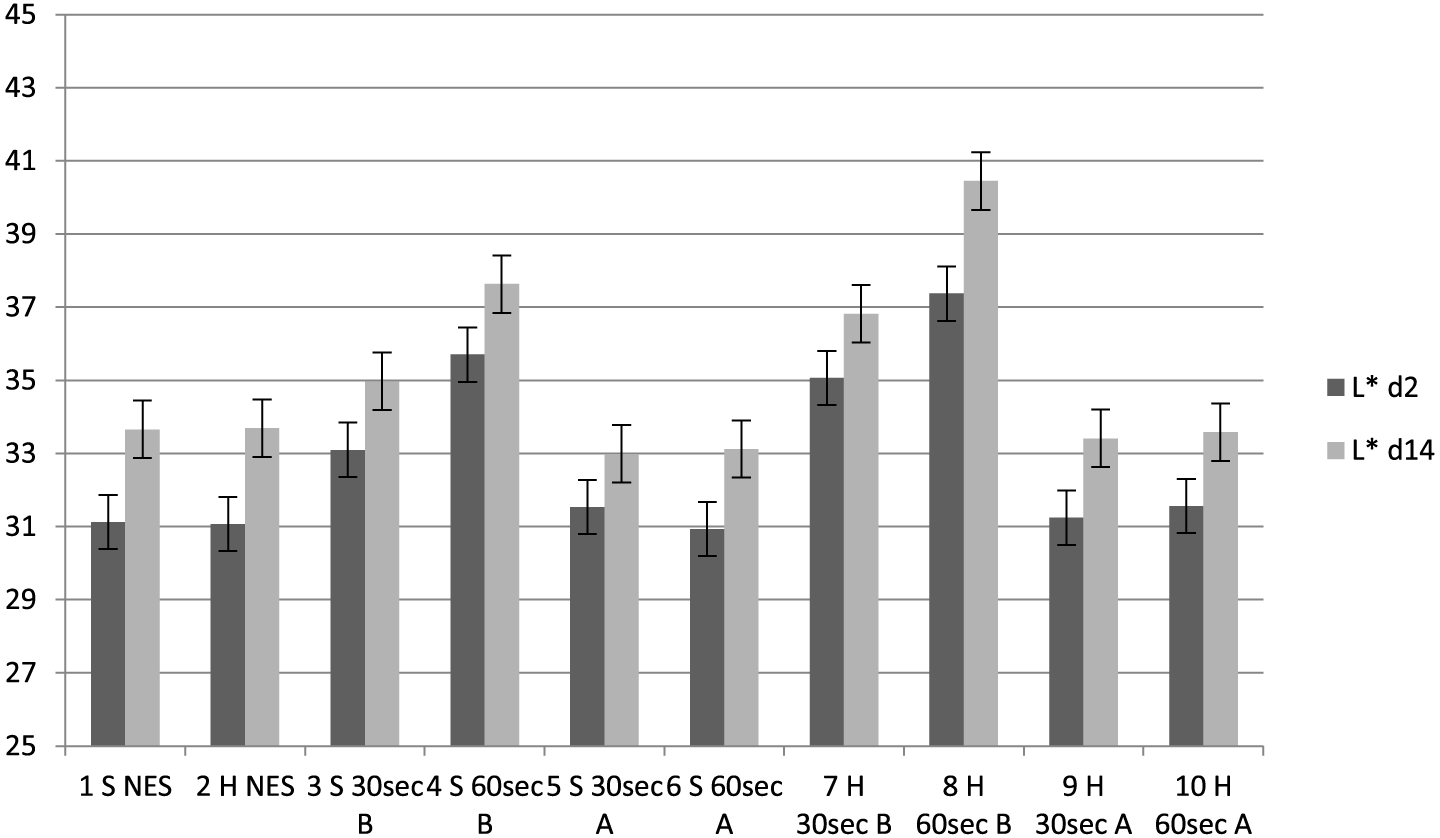
Lightness (L*) values for treatment groups at 2 and 14 d postmortem. 30 s = 30-s stimulation; 60 s = 60-s stimulation; A = late stimulation; B = early stimulation; H = heavy carcasses; L 2d = L* 2 d postmortem; L 14d = L* 14 d postmortem; NES = nonstimulated control; S = small carcasses.
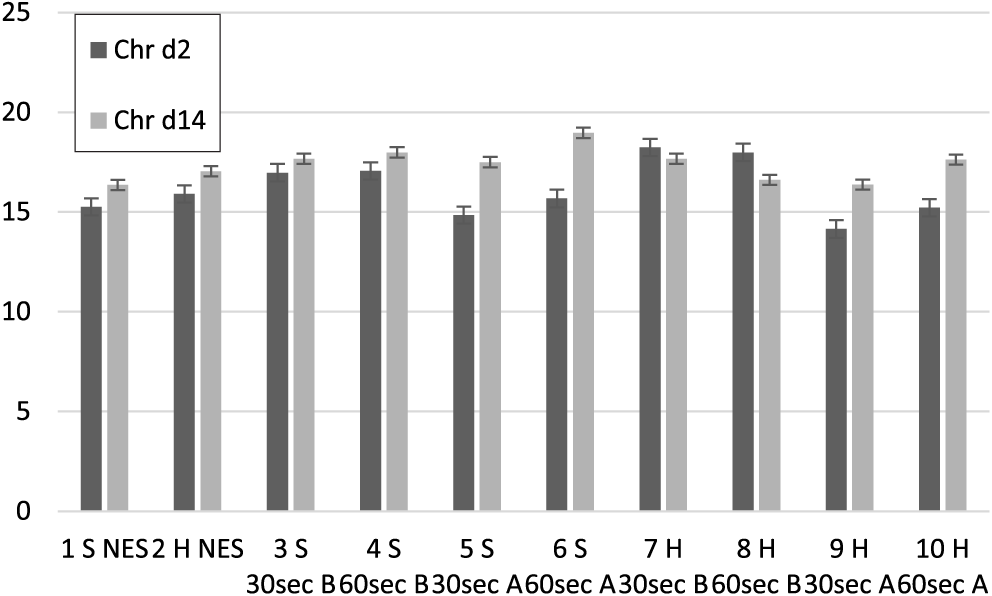
Chroma values (C*) for treatment groups at 2 and 14 d postmortem. 30 s = 30-s stimulation; 60 s = 60-s stimulation; A = late stimulation; B = early stimulation; Chr d2 = chroma value day 2 postmortem; Chr d14 = chroma value day 14 postmortem; H = heavy carcasses; NES = nonstimulated control; S = S small carcasses.
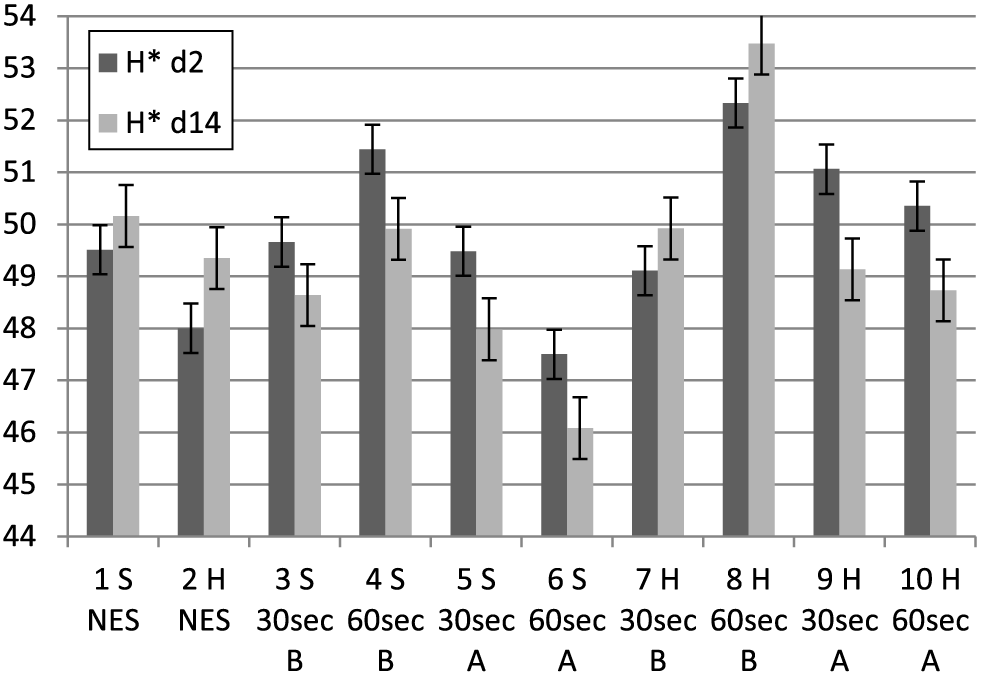
Hue angle (H*) for treatment groups at 2 and 14 d postmortem. 30 s = 30-s stimulation; 60 s = 60-s stimulation; A = late stimulation; B = early stimulation; H = heavy carcasses; H d2 = hue value day 2 postmortem; H d14 = hue value day 14 postmortem; NES = nonstimulated control; S = small carcasses.
In terms of meat lightness (Figure 1), analysis revealed higher variation (R2=0.47) at 2 d postmortem among the treatment groups, but at 14 d postmortem, the variation decreased slightly (R2 = 0.40). All groups, including controls, had marginal increases in L* values from 2 to 14 d postmortem. At 2 d postmortem, early stimulated carcasses (Groups 3, 4, 7, and 8) had the fastest pH decline and the highest L* values (P < 0.05), followed by the late stimulated carcasses (Groups 5, 6, 9, and 10) and the nonstimulated controls, respectively. At 14 d postmortem, early stimulated carcasses also had the highest L* values but followed by controls and late stimulated carcasses, respectively, as shown in Figure 1. Out of the early stimulated groups, carcasses stimulated for 60 s (Groups 4 and 8) produced the highest L* values (P < 0.05) at 2 and 14 d postmortem compared to 30-s duration. The effect of faster glycolysis and pH decline on L* was shown in the correlation of pH with L* values (average r = −0.56 from 45 min to 24 h postmortem), and on initial carcass temperature (average r = −0.30 at 45 min and 3 h postmortem). This was also corroborated by the strong to moderate positive correlation of lactate and glucose with L* values at 2 and 14 d postmortem and the strong negative correlation of CP, ATP, and G6P with L* values early postmortem, as shown in Table 3. There was no significant difference between the 2 carcass weight groups in terms of meat lightness.
Correlations between pH, temperature, energy metabolites, and color attributes
| Attributes | L* day 2 | L* day 14 | C* day 2 | C* day 14 | H* day 2 | H* day 14 |
|---|---|---|---|---|---|---|
| pH 45 min | −0.51** | −0.49** | −0.49** | −0.03 | −0.14 | −0.28** |
| pH 3 h | −0.58** | −0.55** | −0.51** | −0.15 | −0.17* | −0.21* |
| pH 6 h | −0.50** | −0.52** | −0.54** | −0.14 | −0.10 | −0.15 |
| pH 12 h | −0.59** | −0.59** | −0.56** | −0.05 | −0.14 | −0.25* |
| pH 24 h | −0.48** | −0.56** | −0.52** | −0.03 | −0.15 | −0.33** |
| T 45 min | 0.35** | 0.27** | 0.16 | 0.01 | 0.17* | 0.10 |
| T 3 h | −0.30** | −0.24* | −0.23* | 0.08 | −0.04 | −0.24* |
| T 6 h | 0.06 | 0.12 | 0.17* | −0.07 | −0.01 | 0.16 |
| T 12 h | 0.18* | 0.23* | 0.20* | 0.08 | 0.04 | −0.01 |
| T 24 h | −0.06 | −0.03 | 0.08 | 0.14 | −0.13 | −0.23* |
| Lact 1 h | 0.58** | 0.48** | 0.28* | −0.07 | 0.32* | 0.35** |
| Lact 4 h | 0.50** | 0.48** | 0.33* | 0.10 | 0.13 | 0.14 |
| Lact 24 h | 0.26 | 0.21 | 0.24 | 0.13 | 0.00 | −0.13 |
| Glu 1 h | 0.36* | 0.34* | 0.32* | 0.11 | 0.05 | 0.01 |
| Glu 4 h | 0.55** | 0.41* | 0.38* | 0.07 | 0.16 | 0.11 |
| Glu 24 h | 0.46** | 0.36* | 0.36* | 0.16 | 0.11 | 0.08 |
| Gly 1 h | −0.19 | −0.08 | 0.01 | −0.01 | −0.06 | −0.14 |
| Gly 4 h | −0.30* | −0.12 | −0.13 | 0.08 | −0.15 | −0.16 |
| Gly 24 h | −0.28* | −0.13 | −0.08 | −0.06 | −0.18 | −0.17 |
| CP 1 h | −0.33* | −0.32* | −0.38* | −0.04 | −0.05 | −0.18 |
| CP 4 h | −0.36* | −0.26* | −0.18 | 0.02 | −0.08 | −0.21 |
| CP 24 h | 0.09 | 0.08 | 0.03 | 0.07 | 0.15 | 0.01 |
| ATP 1 h | −0.11 | −0.15 | −0.24 | 0.15 | 0.01 | −0.05 |
| ATP 4 h | −0.45** | −0.40* | −0.39* | 0.05 | −0.15 | −0.10 |
| ATP 24 h | −0.19 | −0.15 | −0.14 | −0.11 | −0.01 | 0.11 |
| G6P 1 h | −0.22 | −0.07 | −0.07 | 0.01 | −0.22 | 0.08 |
| G6P 4 h | 0.48** | 0.37* | 0.37* | 0.03 | 0.10 | 0.15 |
| G6P 24 h | 0.09 | 0.20 | 0.24 | 0.20 | −0.10 | −0.07 |
| L* day 2 | 1 | 0.86** | 0.36** | −0.08 | 0.65** | 0.61** |
| L* day 14 | 0.86** | 1 | 0.46** | −0.03 | 0.56** | 0.67** |
| C* day 2 | 0.36** | 0.46** | 1 | 0.20* | −0.19* | 0.08 |
| C* day 14 | −0.08 | −0.03 | 0.20* | 1 | −0.40** | −0.49** |
| H* day 2 | 0.65** | 0.56** | −0.19* | −0.40** | 1 | 0.70** |
| H* day 14 | 0.61** | 0.67** | 0.08 | −0.49** | 0.70** | 1 |
P < 0.05.
P < 0.001.
r ≥ −0.30/0.30 (in bold figures) are regarded as important and significant; r without asterisks are not significant, P > 0.05.
ATP = adenosine diphosphate; C* = meat chroma; CP = creatine phosphate; G6P = glucose-6-phosphate; Glu = glucose; Gly = glycogen; H* = meat hue angle; L* = meat lightness; Lact = lactate; T = temperature.
Regarding chroma (C*) (Figure 2), which is a function of a* and b* values, there were low variations among the treatment groups at 2 d postmortem (R2 = 0.28) and 14 d postmortem (R2 = 0.15). Analysis revealed that early stimulated carcasses, with the fastest pH decline, had the highest chroma values (P < 0.05) at 2 d postmortem followed by the controls and late stimulated groups. Out of the early stimulated carcasses, heavy carcasses (Groups 7 and 8) had the highest (P < 0.05) chroma values, followed by the smaller carcasses (Groups 3 and 4) (Figure 2). At 14 d postmortem, there were marginal increases in chroma values in all treatment groups except Groups 7 and 8, which decreased marginally. The numerical values were close for all groups, but all the carcasses stimulated late (Groups 5, 6, 9, and 10) had a significantly higher increase in C* values (average 17.4%) compared to the early stimulated carcasses (4.8% for small carcasses and 5.5% for heavy carcasses) and controls (average 7.25%). The result implies that the effect of faster pH decline and glycolysis—brought about by early stimulation on chroma—was transient. This was evident in the strong correlation of C* day 2 postmortem with all pH values (from 45 min to 24 h postmortem) as shown in Table 3. Regarding carcass weight, there was no significant difference in chroma values between the small and heavier carcasses. Moreover, meat chroma at 2 d postmortem showed moderate positive correlations with L* values at 2 and 14 d postmortem. In predicting C* at 2 d postmortem from the regression model, pH 3 h postmortem (P = 0.0455; r = −0.51) and L* 2 d postmortem (P = 0.02224; r = 0.36) gave the best predictive values, while C* 14 d postmortem was best predicted by H* at 2 d postmortem (P < 0.0001; r = −0.40).
In terms of hue values (H*) (discoloration) (Figure 3), which is also a function of a* and b* values (tan−1[b*/a*]), there were low variations among the treatments at 2 (R2 = 0.19) and 14 d postmortem (R2 = 0.22). At 2 d postmortem, there were mixed reactions from the treatment groups, but carcasses stimulated early for 60 s (Groups 8 and 4) had marginally higher (P < 0.05) discoloration (H*), which coincides with the highest L* value at 2 and 14 d postmortem, and this was reflected in the strong correlations (Table 3) between L* and H* values. At 14 d postmortem, the nonstimulated carcasses (Groups 1 and 2) and the early stimulated heavy carcasses (Groups 7 and 8) had marginal increases in hue values, while all other carcass groups had marginal decreases. The late stimulated groups (Groups 5, 6, 9, and 10) had the lowest hue values although the numerical differences were negligible. In terms of carcass weight, there was no significant difference between the small and the heavier carcasses at 2 d postmortem, but at 14 d postmortem, the smaller carcasses had significantly higher (P < 0.05) hue values (Tables 4–5). In predicting H* at 2 d postmortem, L* at day 2 (P < 0.0001; r = 0.65) gave the best predictive value. For H* at 14 d postmortem, pH at 24 h postmortem (P = 0.0669; r = −0.32) and L* at 2 d postmortem (P < 0.0001; r = 0.61) gave the best predictive values. Figures 4 and 5 show the muscle lactate and glucose trend values, respectively, for the different treatment groups at 1, 4, and 24 h postmortem.
Means with standard deviation of main effects (CW, ES time, and ES duration) on color attributes at 2 and 14 d postmortem
| Main effects | L* day 2 Mean ± SD | L* day 14 Mean ± SD | C* day 2 Mean ± SD | C* day 14 Mean ± SD | H* day 2 Mean ± SD | H* day 14 Mean ± SD |
|---|---|---|---|---|---|---|
| CW | ||||||
| S | 32.45 ± 2.78 | 34.55 ± 3.22 | 15.99 ± 2.15 | 17.64 ± 2.08 | 49.60 ± 3.06 | 41.31 ± 2.94 |
| H | 33.05 ± 3.14 | 35.16 ± 3.95 | 16.18 ± 2.66 | 17.08 ± 1.79 | 50.13 ± 3.19 | 40.04 ± 3.96 |
| ES t | ||||||
| 0 (NES) | 31.09 ± 1.44 | 33.59 ± 2.78 | 15.53 ± 1.35 | 16.66 ± 1.89 | 48.86 ± 2.72 | 40.19 ± 2.29 |
| B | 35.18 ± 3.20 | 37.12 ± 3.62 | 17.49 ± 2.82 | 17.55 ± 1.83 | 50.57 ± 3.25 | 39.75 ± 3.75 |
| A | 31.32 ± 2.18 | 33.37 ± 2.95 | 14.97 ± 1.52 | 17.59 ± 2.07 | 49.65 ± 3.08 | 41.97 ± 3.46 |
| ES d | ||||||
| 0 (NES) | 31.09 ± 1.44 | 33.59 ± 2.78 | 15.53 ± 1.35 | 16.66 ± 1.89 | 48.86 ± 2.72 | 40.19 ± 2.29 |
| 30 s | 32.66 ± 2.51 | 34.37 ± 3.19 | 16.04 ± 2.76 | 17.31 ± 2.08 | 49.83 ± 3.13 | 41.11 ± 3.26 |
| 60 s | 33.77 ± 3.94 | 36.06 ± 4.15 | 16.42 ± 2.41 | 17.85 ± 1.77 | 50.39 ± 3.24 | 40.61 ± 4.23 |
0 (NES), nonstimulated carcasses; 30 s, 30-s stimulation; 60 s, 60-s stimulation; A, late stimulation; B, early stimulation; CW, carcass weight; ES d, electrical stimulation duration; ES t, electrical stimulation time; H, heavy carcasses; S, small carcasses; SD, standard deviation.
Effects and significance of carcass weight, ES time and duration, and their interactions on meat color attributes (lightness [L*], chroma [C*], and hue angle [H*] at 2 and 14 d postmortem)
| Effects | P value | F ratio | SEM | P value | F ratio | SEM | P value | F ratio | SEM |
|---|---|---|---|---|---|---|---|---|---|
| Main effects | L* day 2 | L* day 14 | C* day 2 | ||||||
| CW | 0.107 | 2.633 | 0.419 | 0.059 | 3.638 | 0.499 | 0.219 | 1.524 | 0.355 |
| Est | 0.000 | 75.265 | 0.331 | 0.000 | 57.118 | 0.395 | 0.000 | 42.988 | 0.281 |
| ESd | 0.022 | 5.371 | 0.326 | 0.005 | 8.321 | 0.388 | 0.293 | 1.115 | 0.276 |
| Main effects | C* day 14 | H* day 2 | H* day 14 | ||||||
| CW | 0.157 | 2.027 | 0.318 | 0.363 | 0.834 | 0.492 | 0.018 | 5.774 | 0.519 |
| Est | 0.591 | 0.290 | 0.252 | 0.030 | 4.793 | 0.390 | 0.000 | 23.710 | 0.411 |
| ESd | 0.117 | 2.485 | 0.247 | 0.456 | 0.559 | 0.383 | 0.602 | 0.273 | 0.404 |
| Interactions | L* day 2 | L* day 14 | C* day 2 | ||||||
| CW × ESt | 0.122 | 2.430 | 0.463 | 0.120 | 2.452 | 0.553 | 0.012 | 6.426 | 0.393 |
| CW × ESd | 0.599 | 0.278 | 0.493 | 0.567 | 0.329 | 0.588 | 0.618 | 0.250 | 0.418 |
| ESt × ESd | 0.004 | 8.562 | 0.482 | 0.007 | 7.551 | 0.574 | 0.296 | 1.103 | 0.409 |
| CW × ESt × ESd | 0.399 | 0.715 | 0.667 | 0.770 | 0.085 | 0.796 | 0.524 | 0.408 | 0.567 |
| Interactions | C* day 14 | H* day 2 | H* day 14 | ||||||
| CW × ESt | 0.585 | 0.301 | 0.352 | 0.154 | 2.061 | 0.545 | 0.293 | 1.117 | 0.575 |
| CW × ESd | 0.368 | 0.816 | 0.374 | 0.418 | 0.659 | 0.580 | 0.311 | 1.037 | 0.612 |
| ESt × ESd | 0.030 | 4.817 | 0.366 | 0.001 | 12.051 | 0.566 | 0.002 | 9.740 | 0.598 |
| CW × ESt × ESd | 0.607 | 0.266 | 0.507 | 0.956 | 0.003 | 0.785 | 0.728 | 0.121 | 0.828 |
Significant P values are indicated in bold.
CW, carcass weight; ESt, electrical stimulation time; ESd, electrical stimulation duration; SEM, standard error of the mean.
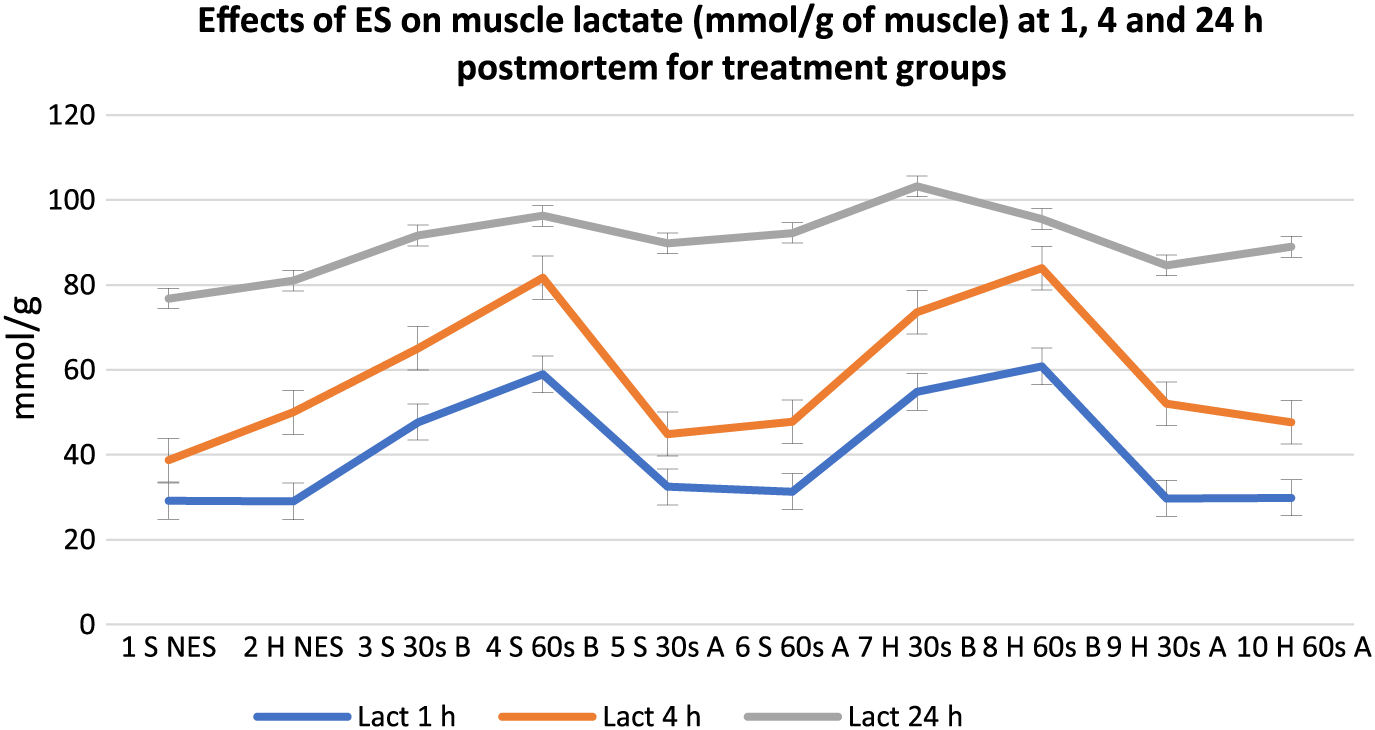
Effects of electrical stimulation on muscle lactate (mmol/g of muscle) at 1, 4, and 24 h postmortem for treatment groups. 30 s = 30-s stimulation; 60 s = 60-s stimulation; A = late stimulation; B = early stimulation; H = heavy carcasses; H d2 = hue value day 2 postmortem; H d14 = hue value day 14 postmortem; NES = nonstimulated control; S = small carcasses.
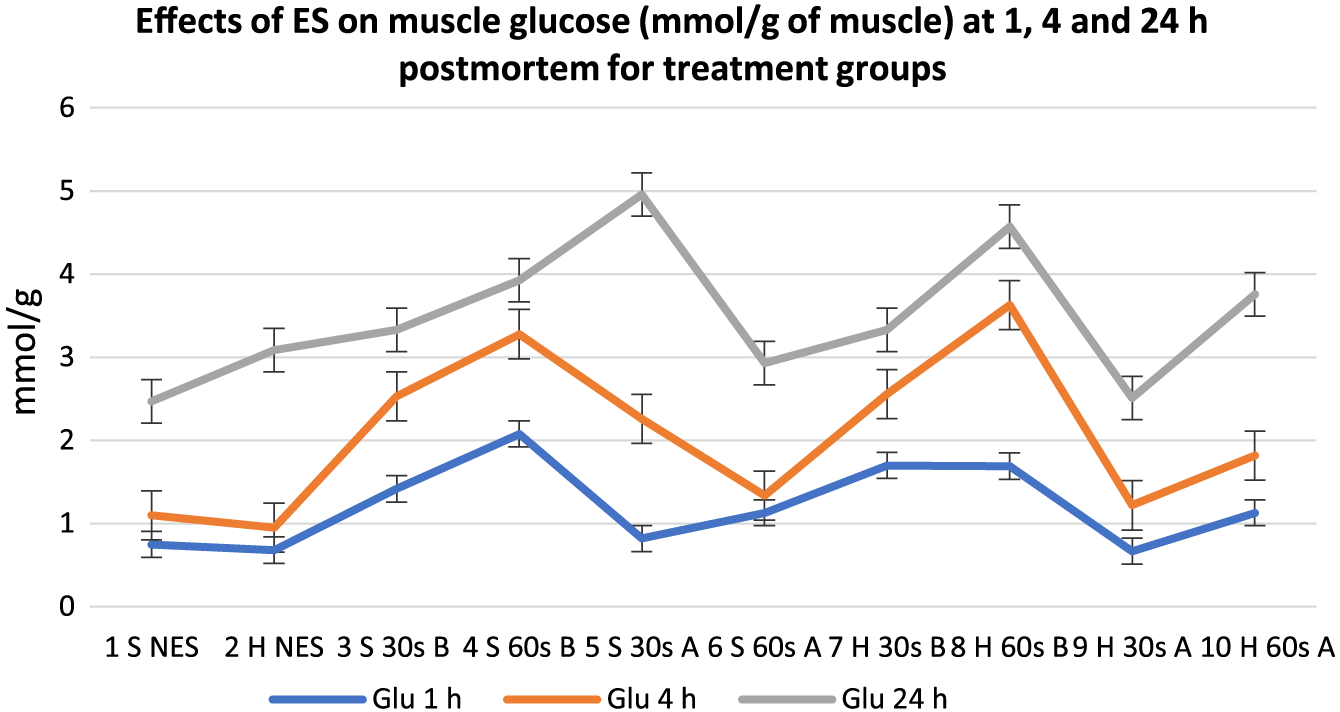
Effects of electrical stimulation on muscle glucose (mmol/g of muscle) at 1, 4, and 24 h postmortem for treatment groups. 30 s = 30-s stimulation; 60 s = 60-s stimulation; A = late stimulation; B = early stimulation; H = heavy carcasses; H d2 = hue value day 2 postmortem; H d14 = hue value day 14 postmortem; NES = nonstimulated control; S = small carcasses.
Meat lactate content showed a general increase in all groups from 1 to 24 h postmortem, but the variation between treatments decreased from 1 to 24 h postmortem. Early stimulated carcasses (Groups 3, 4, 7, and 8), with the fastest pH decline (Table 2), had the highest lactate content at 1 and 4 h postmortem. Out of the early stimulated carcasses, groups stimulated for 60 s (Groups 8 and 4) had the highest lactate content at 1 and 4 h postmortem compared to carcasses stimulated for 30 s. Similarly, early stimulated carcasses had the highest muscle glucose content (P < 0.05) followed by late stimulated carcasses and controls at 1 and 4 h postmortem. At 24 h postmortem, there were mixed reactions from all treatment groups. Figures 6 and 7, respectively, show the mean trend values of muscle glycogen and CP for treatment groups at 1, 4, and 24 h postmortem.
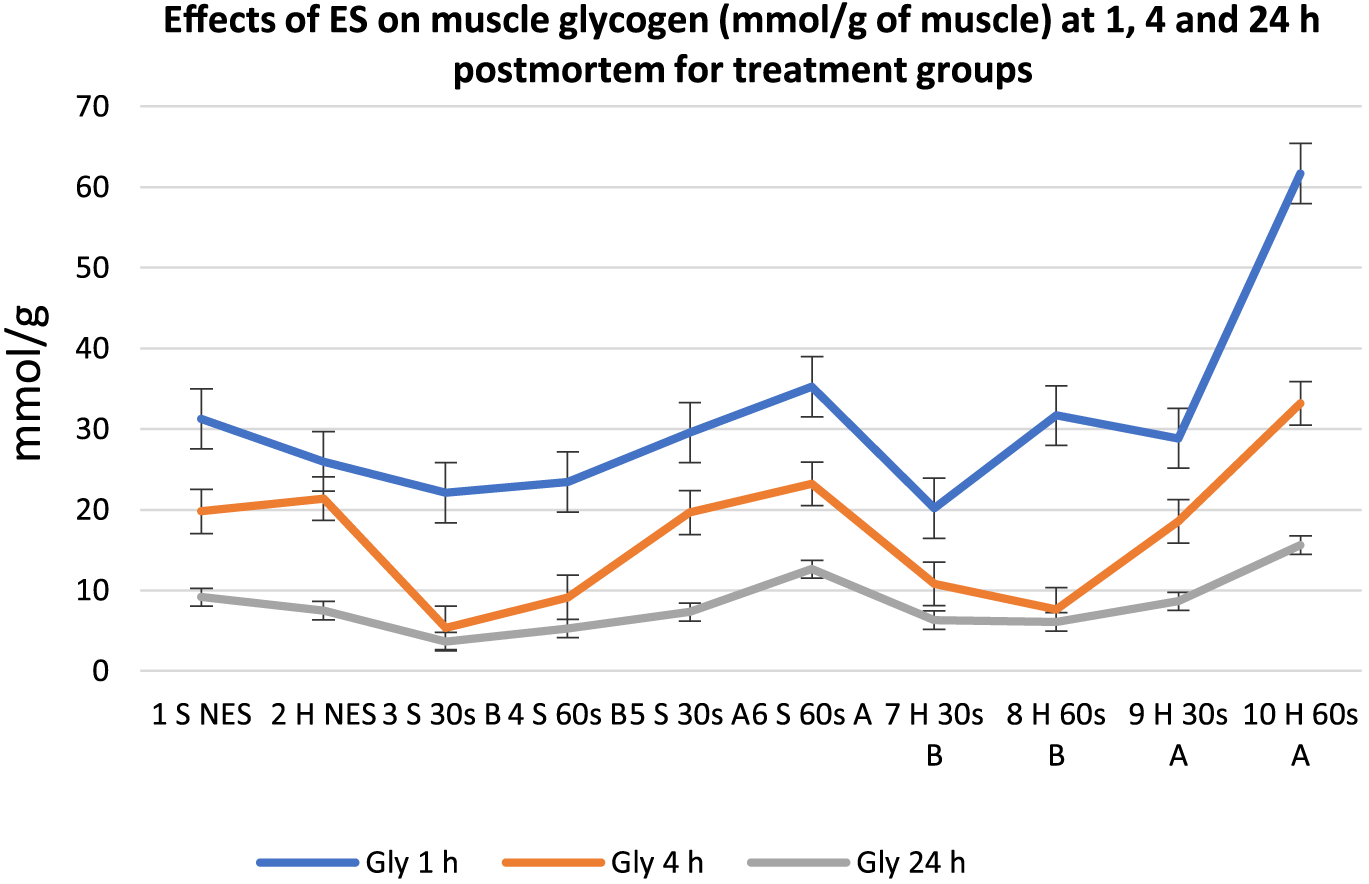
Effects of electrical stimulation on muscle glycogen (mmol/g of muscle) at 1, 4, and 24 h postmortem for treatment groups. 30 s = 30-s stimulation; 60 s = 60-s stimulation; A = late stimulation; B = early stimulation; H = heavy carcasses; H d2 = hue value day 2 postmortem; H d14 = hue value day 14 postmortem; NES = nonstimulated control; S = small carcasses.
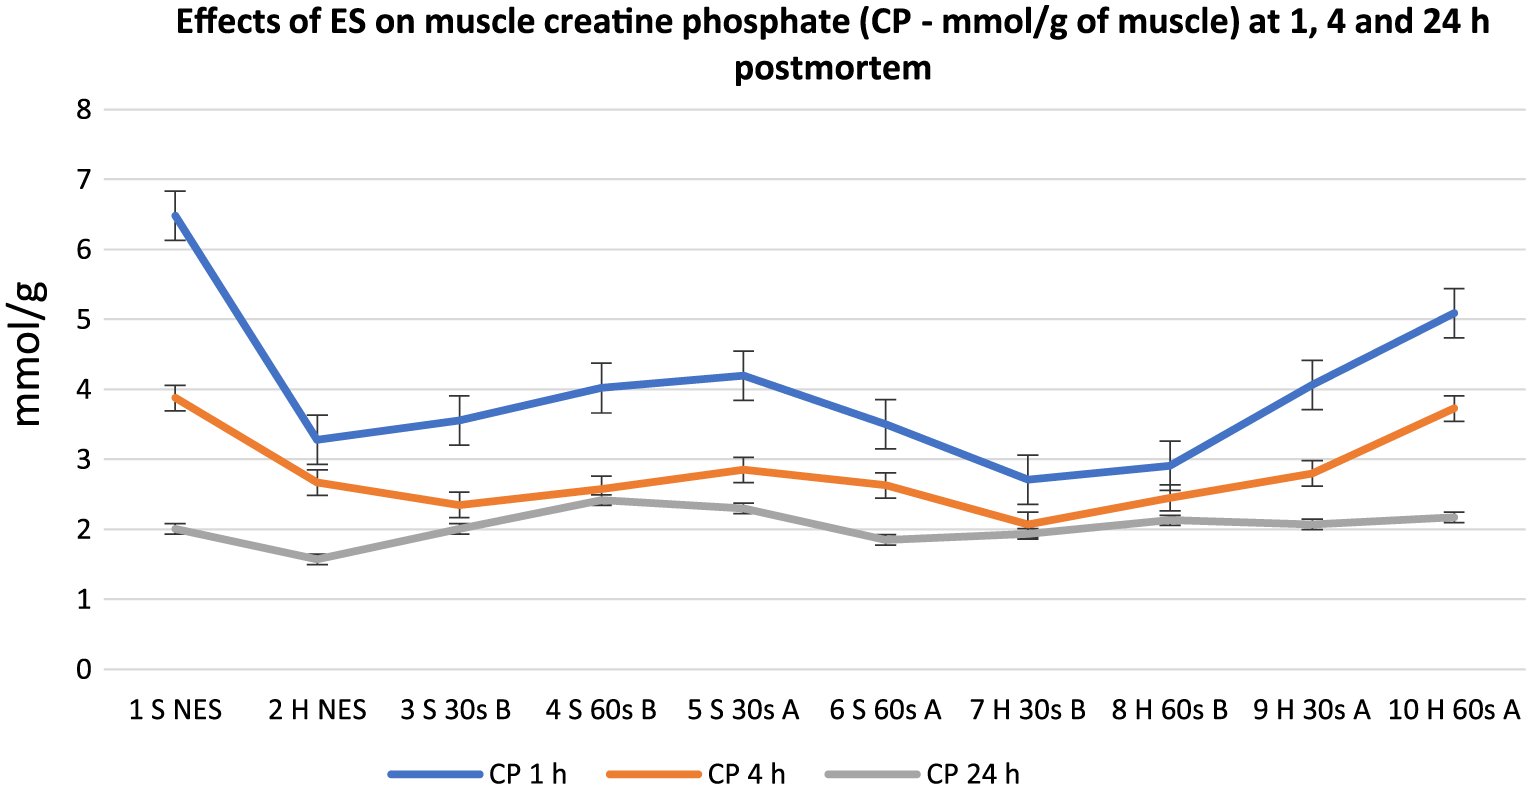
Effects of electrical stimulation on muscle creatine phosphate (mmol/g of muscle) at 1, 4, and 24 h postmortem for treatment groups. 30 s = 30-s stimulation; 60 s = 60-s stimulation; A = late stimulation; B = early stimulation; H = heavy carcasses; H d2 = hue value day 2 postmortem; H d14 = hue value day 14 postmortem; NES = nonstimulated control; S = small carcasses.
There was a general decrease in meat glycogen content from 1 to 24 h postmortem in all carcasses. Carcasses stimulated early (except Group 8), at 1 h postmortem, displayed the lowest glycogen content at 1, 4, and 24 h postmortem. However, at 1 h postmortem, all the treatment groups were not significantly different from one another except for Group 10, which had the highest value (P < 0.05). At 4 and 24 h postmortem, the early stimulated carcasses had significantly lower glycogen values (P < 0.05) compared to the late stimulated carcasses and controls. Out of the late stimulated carcasses that had the highest glycogen content, 60-s stimulation produced the highest glycogen at 1, 4, and 24 h postmortem. CP also showed a general decrease in all carcasses from 1 to 24 h postmortem, but at 1 h postmortem, most of the carcasses stimulated early had the lowest CP values whereas most of the late stimulated carcasses and controls had the highest CP values. A similar pattern was observed at 4 h postmortem, but there were no significant numerical differences among the treatment groups. At 24 h postmortem, there were mixed reactions among all treatment groups, which implies lack of ES effect at 24 h postmortem. There were also mixed reactions on the effects of stimulation duration and carcass weight from 1 to 24 h postmortem on the treatment groups. Figures 8 and 9 show the mean trend values of meat ATP and G6P at 1, 4, and 24 h postmortem.
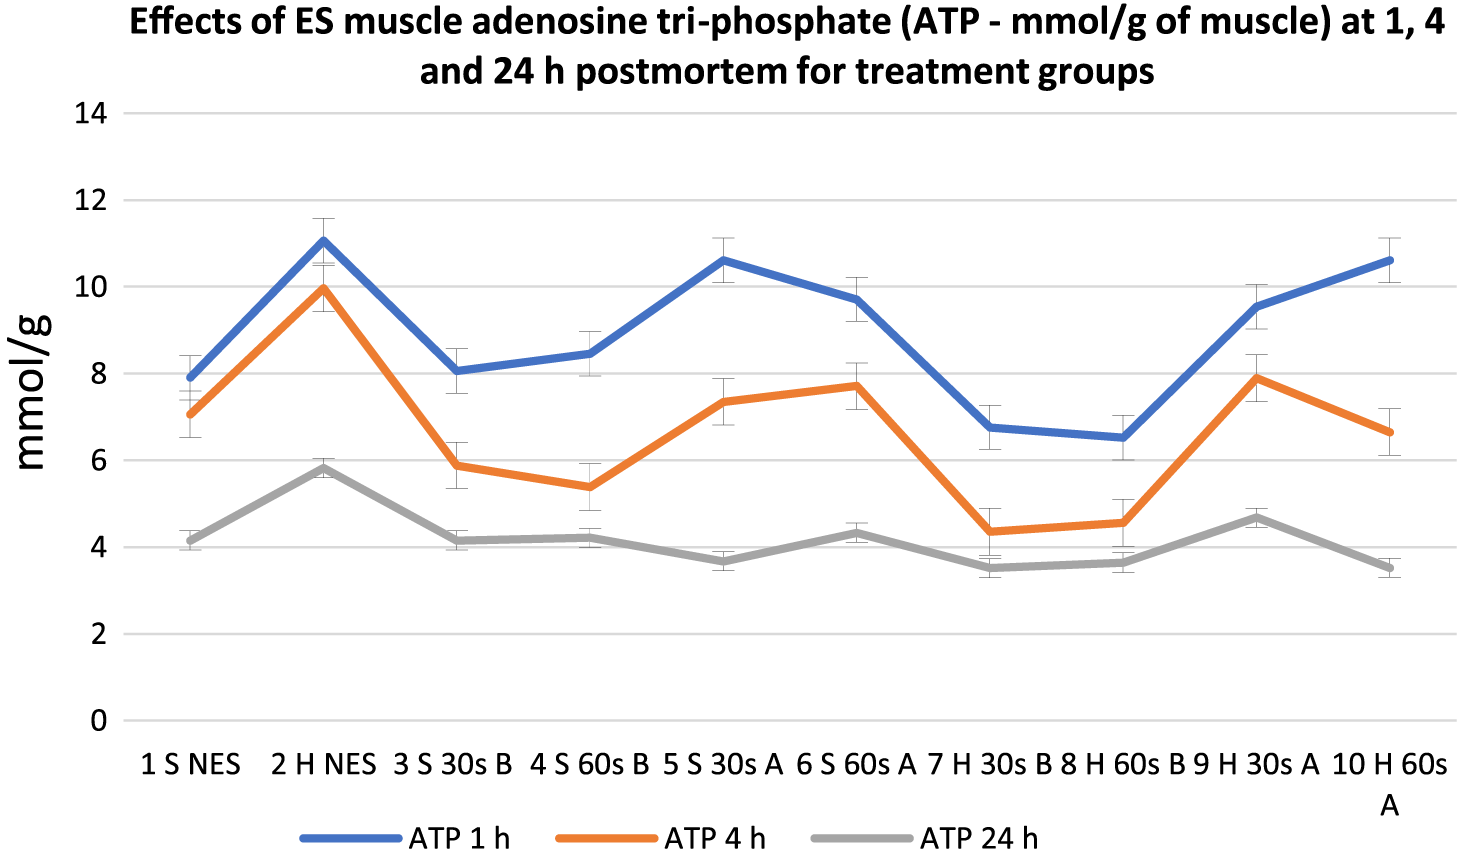
Effects of electrical stimulation on muscle adenosine tri-phosphate (mmol/g of muscle) at 1, 4, and 24 h postmortem for treatment groups. 30 s = 30-s stimulation; 60 s = 60-s stimulation; A = late stimulation; B = early stimulation; H = heavy carcasses; H d2 = hue value day 2 postmortem; H d14 = hue value day 14 postmortem; NES = nonstimulated control; S = small carcasses.
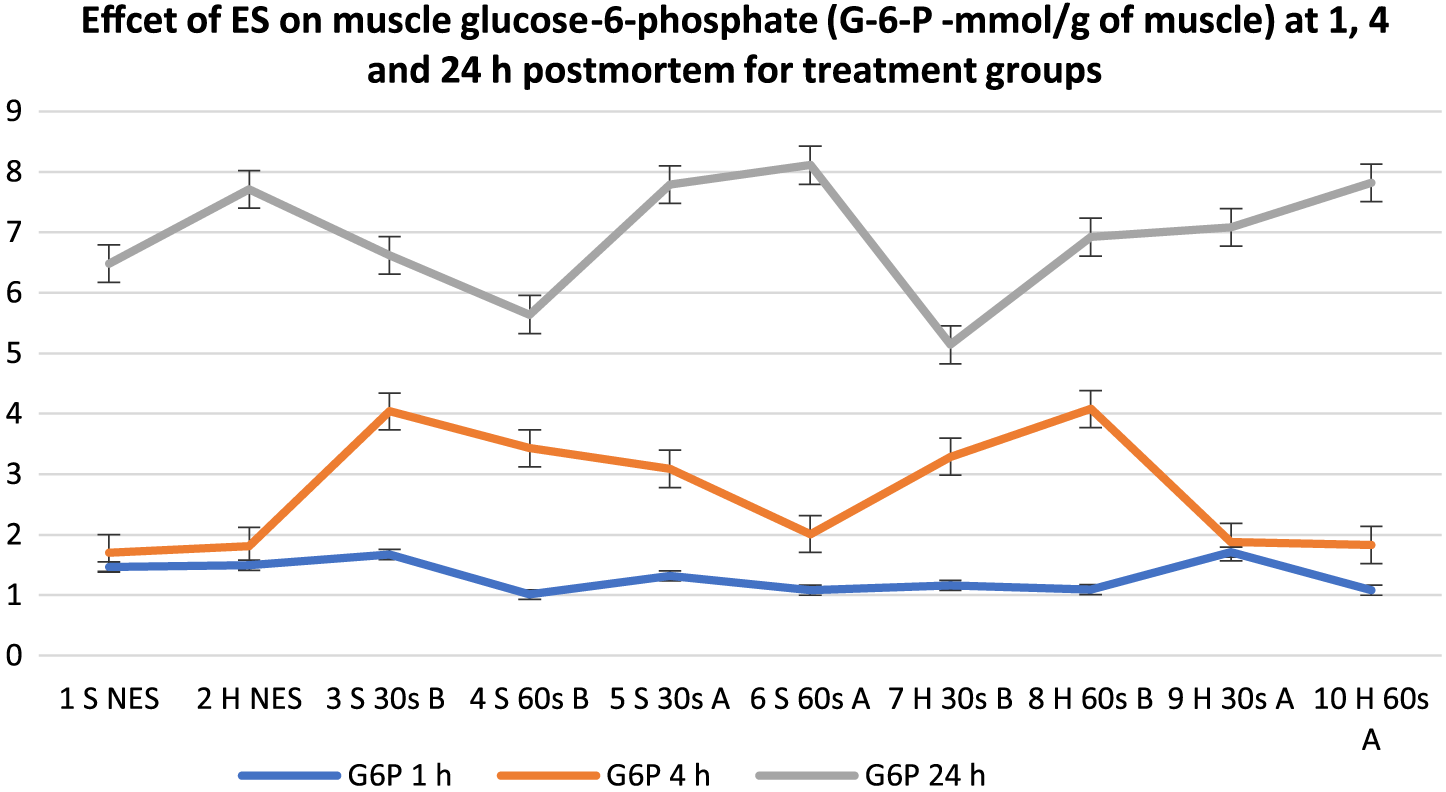
Effects of electrical stimulation on muscle glucose-6-phosphate (mmol/g of muscle) at 1, 4, and 24 h postmortem for treatment groups. 30 s = 30-s stimulation; 60 s = 60-s stimulation; A = late stimulation; B = early stimulation; H = heavy carcasses; H d2 = hue value day 2 postmortem; H d14 = hue value day 14 postmortem; NES = nonstimulated control; S = small carcasses.
Analysis revealed a general decline in ATP from 1 to 24 h postmortem. At 1 h postmortem, early stimulated carcasses (except Group 4) had the lowest (P < 0.05) ATP in the muscle, while most of the late stimulated carcasses (Groups 5, 6, and 9) and control (Group 2) had the highest ATP content. At 4 h postmortem, a clearer pattern of reaction was observed from the groups. All the early stimulated carcasses had the lowest ATP values (P < 0.05), while the controls and the late stimulated carcasses had the highest ATP values but with low numerical differences. At 24 h postmortem, there was no definite pattern of reactions from the treatment groups, and there were no significant differences among all groups except control Group 2, which had the highest ATP value (P < 0.05). Regarding G6P, there were general increases in all the treatment groups from 1 to 24 h postmortem. At 1 h postmortem, there were mixed reactions in terms of time of stimulation, but regarding duration of stimulation, 30-s stimulation (Treatments 3, 5, 7, and 9) and controls (Groups 1 and 2) produced the highest G6P content compared to 60-s duration; however, the differences were not significant because numerical differences were low among all groups. At 4 h postmortem, the early stimulated carcasses had the highest G6P content (P < 0.05) followed by the late stimulated carcasses and controls, respectively, but at 24 h postmortem, there were no significant differences (P > 0.05) among all groups.
Some significant correlations were recorded among carcass pH, temperature, energy metabolites, and meat color attributes, and these are presented in Table 3.
Table 4 shows the means with standard deviation and significance of color attributes and their interactions in relation to the main effects (ES time, ES duration, and carcass weight).
A summary of the average values of the main effects (Treatments: ES time, ES duration, and carcass weight) is presented in Table 5.
Discussion
The present result shows that L* values increased from 2 to 14 d postmortem, which was due to a reduced rate of oxygen consumption as meat aged (Ledward et al., 1986) and myofibrillar lattice shrank (Offer and Trinick, 1983; Swatland, 1993). According to Calkins et al. (1980), the improvement in lean color associated with ES is due to accelerated postmortem glycolysis causing rapid pH decline at high carcass temperature. The higher L* values observed in the early stimulated carcasses at 2 and 14 d postmortem in this study can be related to faster pH decline at higher carcass temperature leading to lower pHu (Jeremiah et al., 1991; Wulf et al., 1997). The findings of Abril et al. (2001) showing that pH is the most influential variable when grouping carcasses according to their color attributes—which also showed that meat is darker as the pHu increases—also accord with the result of this study. The duration of stimulation generally increased L* value in that 60-s stimulation produced the highest L* values (Table 4) at 2 and 14 d postmortem, compared to 30-s stimulation, and this accords with a number of authors who suggested that the longer the duration of stimulation, the paler the meat color (Smulders et al., 1990; Strydom and Frylinck, 2014). The strong correlation between L* values and all pH readings (Table 3) affirms the influence of pH decline on L* values. The effect of faster glycolysis on L* values was also confirmed by the correlation of L* values with energy metabolites as shown in Table 3. The moderate positive correlations of lactate and glucose with L* values imply that, as muscle lactate and glucose increased early postmortem, due to ES, there was a corresponding increase in L* values, and the effect lasted for up to 14 d postmortem, as supported by Eikelenboom and Smulders (1986) and Hector et al. (1992).
The negative correlations of L* values with muscle glycogen, CP, and ATP also imply that the rate of decrease in the concentration of these metabolites brought about a corresponding increase in meat lightness but only at 2 d postmortem. Glycogen is known to decrease postmortem, but the rate of decrease due to ES is higher due to faster glycolysis (Frylinck et al., 2015). According to Polidori et al. (1999), ES increases the re-synthesis of ATP through CP to fuel glycolysis, which brings about the production of lactic acid, which reduces meat pH (Gregory, 1998). All these reactions bore down to increased glycolysis due to ES, which interconnects with all the energy metabolites (Tarrant, 1989; Frylinck et al., 2015). The 60-s, early stimulated carcasses, which brought about the highest L* values and a corresponding high H* value, are also reflective of their strong correlations as indicated in Table 3 (Marsh et al., 1987). The results accord with Roeber et al. (2000) and Mareko (2000), who indicated that higher intensity of ES leads to higher L* and H* values. The interaction of ES time and duration emerged as the most significant combination which significantly (P < 0.05) affects L* values at 2 and 14 d postmortem (Table 5), while carcass weight showed insignificant influence on L* values.
Regarding chroma (C*) values (vividness of red color), the pattern of reaction at 2 d postmortem showed a strong influence of pH decline and time of stimulation as the early stimulated carcasses had the highest C* values. Chroma value is known to be enhanced by LVES, but the time of stability is usually shorter compared to L* value (Eikelenboom et al., 1985; Toohey et al., 2008). Meat ageing reduces oxygen consumption, which reduces the bright cherry-red color of the meat due to the accumulation of metmyoglobin (Ledward, 1985). Li et al. (2011) applied LVES (80 V, 35 s) after dressing and recorded a declining C* value after 24 h postmortem, which implies less color stability. In the present study, apart from Groups 7 and 8, which had marginal decrease in C* values at 14 d postmortem, there were marginal increases in all other groups at 14 d postmortem. This implies less metmyoglobin formation from 2 to 14 d postmortem, and this contrasts with the work of some authors who found significant reduction in C* values from 24 h postmortem in both ES and non-ES samples (Ledward et al., 1986; Bekhit et al., 2007; Li et al., 2011). The superior color stability of longissimus dorsi is known to be higher compared to other muscles. According to Joseph et al. (2012), longissimus steaks have overabundance of antioxidant proteins and chaperones, which correlates positively with surface redness, e.g., creatine kinase (r = +0.72) and pyruvate dehydrogenase (r = 0.65). However, some authors support the findings of this study, i.e., reduced metmyoglobin formation and brighter red color but mostly for a shorter ageing period (e.g., 72 h postmortem) (Renerre, 1984; Eikelenboom et al., 1985) and especially in the heavier carcasses as shown in Table 4 (Savell et al., 1978). At 2 d postmortem, all the early stimulated carcasses (Groups 3, 4, 7, and 8) had higher C* values (P < 0.05) compared to the late stimulated carcasses and controls, but at 14 d postmortem, there were mixed reactions from the treatment groups, and numerical differences were low among all carcass groups. This implies less influence of ES at 14 d postmortem. Causal factors were reflected in the correlation of C* value with pH and energy metabolites (Table 3). Significant negative correlations were recorded between C* 2 d postmortem and all pH values (average r = −0.52 from 45 min to 24 h postmortem), and this implies that, as pH declined early postmortem, C* values increased. Most of the energy metabolites (lactate, glucose, CP, ATP, and G6P) also correlated moderately with C* values at 2 d postmortem (Table 3). This suggests that faster glycolysis, as seen in the early stimulated carcasses, played a major role in the 2-d-postmortem, enhanced higher C* value in this study, as suggested by van Laack and Smulders (1990). Another plausible explanation is the involvement of metmyoglobin reductase activity (MRA), which plays an important role in maintaining the bright cherry-red color of meat when kept stable (Bekhit and Faustman, 2005). MRA has been reported to be stable for up to 10 d postmortem after which the value dropped to 0 (Wu et al., 2014). MRA has also been reported to be affected by lactate dehydrogenase-A, a protein representative of glycolytic and oxidative metabolism (Kim et al., 2009). These authors indicated that lactate enhancement improved color stability of fresh beef by providing superior antioxidant capacity, increasing the reducing ability and elevating nicotinamide adenine dinucleotide concentration, which is utilized for metmyoglobin reduction, leading to maintenance of ferrous myoglobin. Dalle Zotte et al. (2005) suggested a potential relationship between postmortem discoloration and glycolytic metabolism, and they speculated that the faster the glycolysis, the redder the meat. The report by Wu et al. (2014) shows that lactate dehydrogenase-A chain isoform correlates strongly with a* values, MRA, and pH, but the proteins showed decreased tendency during 5-, 10-, and 15-d storage. A plausible explanation for Groups 7 and 8 (early stimulated heavy carcasses) having marginally lower C* value at 14 d postmortem could be the combination of faster glycolysis and higher carcass fat content. Myoglobin and lipid oxidation have been reported to be facilitators of discoloration (Nair et al., 2014). According to Sammel et al. (2002b), traditional chilling of large carcasses could be damaging to color stability as the rapid pH decline at higher carcass temperature in deep muscles causes more protein denaturation and less color stability. Chroma day 2 postmortem also showed moderate correlations with L* values day 2 (r = 0.36) and day 14 (r = 0.46) postmortem, but at 14 d postmortem, C* values did not show any correlations of pH with any of the energy metabolites. Again, this reaffirms the effect of faster pH decline early postmortem with initial high carcass temperature. The regression model—which pointed to pH 3 h postmortem and L* 2 d postmortem for the prediction of C* 2 d postmortem—also accords with the findings of Eikelenboom et al. (1985) and others, who found pH decline to be a major factor in predicting and determining C* values postmortem. The result shows that early application of LVES favored early-postmortem-meat C* value whereas late application favored an increase in C* at 14 d postmortem, and this could be attributed to slower pH decline.
Regarding H* value, the effects of 60-s stimulation were seen in samples from Groups 4 (S es60B) and 8 (H es60B) (early stimulated) having the highest discoloration (H*) at 2 d postmortem. Overall, 60-s stimulation produced a higher H* value at 2 d postmortem, while 30-s stimulation produced a higher but not significant H* value at day 14 postmortem. H* values also correlated positively strongly with the L* values at 2 d postmortem (r = 0.65) and 14 d postmortem (r = 0.67), and this shows a direct relationship of both color attributes. Early stimulated carcasses (Groups 3,4, 7, and 8), especially the ones stimulated for 60 s (Groups 4 and 8), had the highest L* values at 2 and 14 d postmortem, and this was evident in the strong correlation of muscle lactate (1 and 4 h postmortem) and all pH, L*, and H* values. This shows that, as L* value increases postmortem, discoloration (H*) also increases, as observed by Mareko (2000). Basically, discoloration is due to a reduced rate of oxygen consumption as meat ages (Ledward et al., 1986) and myofibrillar lattice shrinks (Offer and Trinick, 1983; Swatland, 1993). This theory is also supported by Wu et al. (2014), who concluded that several proteins and their reduction/denaturation through glycolytic activity, energy metabolism, and redox process postmortem affect discoloration as meat ages. Buts et al. (1986) suggested that ES brought about increased lightness due to accelerated denaturation of protein, which accords with the results of George et al. (1980), who found irregular bands of denatured sarcoplasmic proteins deposited within fibers of ES muscles, analogous to pale, soft, and exudative meat in pig muscles. The report by Roeber et al. (2000) indicated that ES duration and voltage intensity affect color, which accords with the result of this study, in which highest values for L*, b*, and H* were recorded for Groups 8 and 4, which were stimulated early postmortem for 60 s. Heavy carcasses that were stimulated early postmortem (Groups 8 and 7) showed marginal increase in H* values at 14 d postmortem compared to other groups, which showed marginal decreases. Overall, in terms of carcass weight, heavier carcasses showed an increase in H* value at 2 d postmortem compared to the smaller carcasses, but the difference was not significant. However, at 14 d postmortem, heavier carcasses displayed a significantly lower H* value (P < 0.05) compared to the smaller carcasses. This implies that heavy carcasses with faster pH decline coincided with higher H* values at 2 d postmortem probably due to early lipid oxidation (Nair et al., 2014). Regarding the time of stimulation, overall, at 2 d postmortem, early stimulated carcasses had the highest H* values, but at 14 d postmortem, early stimulated carcasses had a significantly (P < 0.05) lower H* value as shown in Tables 4–5. Again, this shows the effects of faster pH decline early postmortem on H* value which did not last for long (Hwang et al., 2003). The combination of treatments that made significant differences (P < 0.05) in H* values at 2 and 14 d postmortem was ES time and ES duration (Table 5)—although there were no statistically significant differences among all treatment groups in terms of H* value except for the early stimulated (60-s) heavy carcasses (Group 8), which had the highest values (P < 0.05). In this case, the heavy carcass weight and 60-s early stimulation played out in the high H* value for Group 8 as suggested by Sammel et al. (2002b). This shows that late application of LVES favored H* values (less discoloration) early postmortem—which can be attributed to slower pH decline as indicated in the correlations—whereas early application of LVES favored H* values at a longer ageing period (14 d postmortem). The regression model also showed that H* values at 2 and 14 d postmortem can best be predicted by pHu and L* 2 d postmortem, and this was shown in the strong positive correlations of L* and H* values at 2 and 14 d postmortem (Table 3).
Conclusions
It is concluded that early application of LVES significantly increased L* values, which lasted for a longer period (14 d postmortem) and resulted in higher chroma values at 2 d postmortem, whereas late stimulation produced a small increase in chroma values at 14 d postmortem. It is also concluded that early application of LVES on heavier carcass weight does not favor chroma stability for a longer ageing period (14 d) compared to lighter carcasses. The interaction of ES time and duration of application produced significant differences in all the color attributes (except C* 2 d postmortem) at 2 and 14 d postmortem, whereas carcass weight showed little or no influence on color attributes—except for H* values 14 d postmortem, such that heavy carcasses showed significantly lower discoloration. In terms of color stability, it is concluded that early postmortem pH (3 h), L* measured on day 2 postmortem, and H* measured on day 2 postmortem could be used to predict C* values for up to 14 d postmortem. Hue angle could also be predicted by the early postmortem L* value (2 d postmortem) and pH at 24 h postmortem for 14-d-aged meat. This could help the meat industry in early grading and quality assurance of carcasses and meat. The use and early application of LVES on heavy carcasses should be encouraged for its benefits to meat chroma values, especially at the abattoir/during the butchery period. In other words, the application of LVES on heavier carcasses is advantageous for meat color, but the advantages diminish as ageing progresses.
Acknowledgements
We acknowledge the Red Meat Research and Development Trust of South Africa and the National Research Foundation of South Africa (Reference: TR2010072600041) for funding this study. We also want to acknowledge the Meat Industry Center, Animal Production Institute, Irene, Pretoria, South Africa, for allowing us to use their laboratory for the analysis of samples. The ethical clearance number for this study is EC039-10.
Literature Cited
Aalhus, J. L., S. D. M. Jones, S. Lutz, D. R. Best, and W. M. Robertson. 1994. The efficacy of high and low voltage electrical stimulation under different chilling regimes. Can. J. Anim. Sci. 74:433–442. doi: https://doi.org/10.4141/cjas94-062.
Abril, M., M. O. Campo, A. Onenc, C. Sanudo, P. Alberti, and A. I. Negueruela. 2001. Beef color evolution as a function of ultimate pH. Meat Sci. 58:69–78. doi: https://doi.org/10.1016/S0309-1740(00)00133-9.
Agbeniga, B., and E. C. Webb. 2012. Effects of slaughter technique on bleed-out, blood in the trachea and blood splash in the lungs of cattle. S. Afr. J. Anim. Sci. 45:524–529.
Bekhit, A. E. D., and C. Faustman. 2005. Metmyoglobin reducing activity. Meat Sci. 71:407–439. doi: https://doi.org/10.1016/j.meatsci.2005.04.032.
Bekhit, A. E. D., M. M. Farouk, L. Cassidy, and K. V. Gilbert. 2007. Effects of rigor temperature and electrical stimulation on venison quality. Meat Sci. 75:564–574. doi: https://doi.org/10.1016/j.meatsci.2006.09.005.
Bernt, E., H. U. Bergmeyer, and H. Mollering. 1974. Creatine: In: Bergmeyer, H. U., editor, Methods of enzymatic analysis. 2nd edition, vol. 3. GmbH, Weinhiem: VerlagChemie. p. 1772–1776.
Buts, B., M. Casteel, E. Claeys, and D. Demeyer. 1986. Effects of electrical stimulation followed by moderate cooling on meat quality characteristics of veal longissimus dorsi. Meat Sci. 18:271–279. doi: https://doi.org/10.1016/0309-1740(86)90017-3.
Calkins, C. R., J. W. Savell, G. C. Smith, and C. E. Murphy. 1980. Quality indicating characteristics of beef as affected by electrical stimulation and post-mortem chilling time. J. Food Sci. 45:1330–1332.
Calnan, H. B., R. H. Jacob, D. W. Pethick, and G. E. Gardner. 2014. Factors affecting the color of lamb meat from the longissimus muscle during display: The influence of muscle weight and muscle oxidative capacity. Meat Sci. 96:1049–1057. doi: https://doi.org/10.1016/j.meatsci.2013.08.032.
Chrystall, B. B., C. E. Devine, and C. L. Davey. 1980. Studies in electrical stimulation post-mortem decline in nervous response in lambs. Meat Sci. 4:69–76. doi: https://doi.org/10.1016/0309-1740(80)90024-8.
CIE. 1986. Colorimetry. CIE Publishing No. 152. 2nd ed. Commission International de I’Eclairage, Vienna.
Dalle Zotte, A., H. Remignon, and J. Ouhayoun. 2005. Effects of feed rationing during post-weaning growth on meat quality, muscle energy metabolism and fiber properties of Biceps femoris muscle in rabbit. Meat Sci. 70:301–306. doi: https://doi.org/10.1016/j.meatsci.2005.01.016.
Dalrymple, R. H., and R. Hamm. 1973. A method for extraction of glycogen and metabolites from a single muscle sample. Int. J. Food Sci. Tech. 8:439–444. doi: https://doi.org/10.1111/j.1365-2621.1973.tb01730.x.
Eikelenboom, G., and F. J. M. Smulders. 1986. Effects of electrical stimulation on veal quality. Meat Sci. 16:103–112. doi: https://doi.org/10.1016/0309-1740(86)90069-0.
Eikelenboom, G., F. J. M. Smulders, and H. Ruderus. 1985. The effect of high and low voltage electrical stimulation on beef quality. Meat Sci. 15:247–254. doi: https://doi.org/10.1016/0309-1740(85)90080-4.
Fabianson, S., and A. Laser Reuterswärd. 1985. Low voltage electrical stimulation and post-mortem energy metabolism in beef. Meat Sci. 12:205–223. doi: https://doi.org/10.1016/0309-1740(86)90052-5.
Fiems, L O. 1987. Effect of beta-adrenegic agonists in animal production and their mode of action. Ann Zootech. 36:271–290.
Frylinck, L., A. O’Neill, E. du Toit, P. E. Strydom, and E.C. Webb. 2015. The beef tenderness model. S. Afr. J. Anim. Sci. 45:234–248.
George, A. R., J. R. Bendall, and R. C. D. Jones. 1980. The tenderizing effect of electrical stimulation of beef carcasses. Meat Sci. 4:51–68. doi: https://doi.org/10.1016/0309-1740(80)90023-6.
Gregory, N. G. 1998. Animal welfare and meat science. University Press, Cambridge, UK.
Gutmann, I., and A. W. Wahlfeld. 1974. L (+) lactate determination with lactate dehydrogenase and NAD. In: H. U. Bergmeyer, editor, Methods of enzymatic analysis. 2nd edition, vol. 3. GmbH, Weinheim: VerlagChemie. p. 1464–1468.
Hanson, D. J., and C. R. Calkins. 2001. The effects of post-mortem time and temperature on glycolytic potential of beef muscle. Nebraska Beef Cattle Reports, Paper 299. https://digitalcommons.unl.edu/animalscinbcr/index.9.html#year_2001/
Hector, D. A., C. Brew-Graves, N. Hanssen, and D. A. Ledward. 1992. Relationship between myosin denaturation and the color of low voltage electrically stimulated beef. Meat Sci. 31:299–307. doi: https://doi.org/10.1016/0309-1740(92)90060-H.
Hildrum, K. I., M. Solvang, B. N. Nilsen, T. Froystein, and J. Berg. 1999. Combined effects of chilling rate, low voltage electrical stimulation and freezing on sensory properties of bovine M-longissimus dorsi. Meat Sci. 52:1–7. doi: https://doi.org/10.1016/S0309-1740(98)00142-9.
Hope-Jones, M, P. E. Strydom, L. Frylinck, and E. C. Webb. 2010. The efficiency of electrical stimulation to counteract the negative effects of beta-agonists on meat tenderness of feedlot cattle. Meat Sci. 86:699–705. doi: https://doi.org/10.1016/j.meatsci.2010.06.008.
Hwang, I. H., and J. M. Thompson. 2001a. The effect of time and type of electrical stimulation on the calpain system and meat tenderness in beef longissimus dorsi muscle. Meat Sci. 58:135–144. doi: https://doi.org/10.1016/S0309-1740(00)00141-8.
Hwang, I. H., C. E. Devine, and D. L. Hopkins. 2003. The biochemical and physical effects of electrical stimulation on beef and sheep meat tenderness. Meat Sci. 65:677–691. doi: https://doi.org/10.1016/S0309-1740(02)00271-1.
Jeremiah, L. E., A. K. W. Tong, and L. L. Gibson. 1991. The usefulness of muscle color and pH for segregating beef carcasses into tenderness groups. Meat Sci. 30:97–114. doi: https://doi.org/10.1016/0309-1740(91)90001-7.
Joseph, P., S. P. Suman, G. Rentflow, S. Li, and C. M. Beach. 2012. Proteomics of muscle-specific beef color stability. J. Agr. Food Chem. 60:3196–3203. doi: https://doi.org/10.1021/jf204188v.
Keepler, D., and K. Decker. 1974. Glycogen determination with amyloglucosidase. In: H. U. Bergmeyer, editor, Methods of enzymatic analysis. 2nd edition, vol. 3. GmbH, Weinheim: VerlagChemie. p. 1127–1131.
Killinger, K. M., W. J. Calkins, W. J. Umberger, D. M. Feuz, and K. M. Eskridge. 2004. Consumer visual preferences and value for beef steaks differing in marbling level and color. J. Anim. Sci. 82:3288–3293. doi: https://doi.org/10.2527/2004.82113288x.
Kim, Y. H., J. Y. Keeton, H. S. Yang, B. Smith, J. E. Sawyer, and J. W. Savell. 2009. Color stability and biochemical characteristics of bovine muscles when enhanced with L- or potassium lactate in high-oxygen modified atmospheres. Meat Sci. 82:234–240. doi: https://doi.org/10.1016/j.meatsci.2009.01.016.
Ledward, D. A. 1985. Post-slaughter influences on the formation of metmyoglobin in beef muscles. Meat Sci. 15:149–171. doi: https://doi.org/10.1016/0309-1740(85)90034-8.
Ledward, D. A., R. F. Dickinson, V. H. Powell, and W. R. Shorthose. 1986. The color and color stability of beef longissimus dorsi and semimembranosus muscles after effective electrical stimulation. Meat Sci. 16:245–265. doi: https://doi.org/10.1016/0309-1740(86)90037-9.
Li, C. B., J. Li, X. Li, M. Hviid, and K. Lundstrom. 2011. Effects of low voltage electrical stimulation after dressing on color stability and water holding capacity of bovine longissimus muscle. Meat Sci. 88:559–565. doi: https://doi.org/10.1016/j.meatsci.2011.02.012.
MacDougall, D. B. 1977. Color in meat. In: G. G. Birch., J. G. Brennan, and K. Parker, editors, Sensory properties of foods. London: Applied Science Publishers. p. 59.
Mancini, R. A., and M. C. Hunt. 2005. Current research in meat color. Meat Sci. 71:100–121. doi: https://doi.org/10.1016/j.meatsci.2005.03.003.
Mareko, M. H. D. 2000. Effects of pre-slaughter stress and electrical stimulation intensity on meat tenderness. MSc thesis, Lincoln University, New Zealand. +++https://researcharchive.lincoln.ac.nz/handle/10182/6/browse?type=author&value=Mareko%2C+Molebeledi+Horatius+Dambe.
Marsh, B. B., T. P. Ringkob, R. L. Russell, R, D. R. Swartz, and L. A. Pagel. 1987. Effects of early post-mortem glycolytic rate on beef tenderness. Meat Sci. 21:241–248. doi: https://doi.org/10.1016/0309-1740(87)90061-1.
McGilchrist, P., C. L. Alston, G. E. Gardner, K. L. Thomson, and D. W. Pethick. 2012. Beef carcasses with larger eye muscle area, lower ossification scores and improved nutrition have a lower incidence of dark cutting. Meat Sci. 92:474–480. doi: https://doi.org/10.1016/j.meatsci.2012.05.014.
MLA and AMPC. 2011. Heat toughening part 2: Strategies for reducing the incidence of heat toughening in beef carcasses. Meat and Livestock Australia and Australian Meat Processor Corporation. CSIRO Publishing, Collingwood, Australia. p. 1–4.
Monin, G., and P. Sellier. 1985. Pork of low technological quality with normal rate of muscle pH fall in the immediate post-mortem period: the case of the Hampshire breed. Meat Sci. 13:49–63. doi: https://doi.org/10.1016/S0309-1740(85)80004-8.
Nair, M. N., S. P. Suman, S. Li, R. Ramanathan, and R. A. Mancini. 2014. Temperature- and pH-dependent effects of lactate on in-vitro redox stability of red meat myoglobins. Meat Sci. 96:408–412. doi: https://doi.org/10.1016/j.meatsci.2013.07.033.
Offer, G., and J. Trinick. 1983. Developments in electrical stimulation and monitoring. Proceedings of the 28th Meat Industry Research Conference, Auckland, New Zealand. The Meat Industry Research Institute, Auckland, New Zealand. p. 271–277.
Pethick, D. W., L. Cummins, G. E. Gardner, B. W. Knee, M. McDowell, T. G. McTyre, P. J. Walker, and R. D. Warner. 1999. The regulation by nutrition of glycogen in the muscle of ruminants. Rec. Adv. An. 12:145–152.
Polidori, P., S. Lee, R. G. Kauffman, and B. B. Marsh. 1999. Low voltage electrical stimulation of lamb carcasses: effects on meat quality. Meat Sci. 53:179–182. doi: https://doi.org/10.1016/S0309-1740(99)00044-3.
Renerre, M. 1984. Effect of electrical stimulation on meat color. Sci. Aliment. 4:567–584.
Roeber, D. L., R. C. Cannell, K. E. Belk, R. K. Millar, R., J. D. Tatum, and G. C. Smith. 2000. Effects of a unique application of electrical stimulation on tenderness, color, and quality attributes of beef longissimus muscle. J. Anim. Sci. 78:1504–1509. doi: https://doi.org/10.2527/2000.7861504x.
Sammel, L. M., M. C. Hunt, D. H. Kropf, K. A. Hachmeister, C. L. Kastner, and D. E. Johnson. 2002a. Comparison of assays for metmyoglobin reducing ability in beef inside and outside semimembranosus muscle. J. Food Sci. 67:978–984. doi: https://doi.org/10.1111/J.1365-2621.2002.TB09439.X.
Sammel, L. M., M. C. Hunt, D. H. Kropf, K. A. Hachmeister, C. L. Kastner, and D. E. Johnson. 2002b. Influence of chemical characteristics of beef inside and outside semimembranonsus on color traits. J. Food Sci. 67:1323–1330. doi: https://doi.org/10.1111/j.1365-2621.2002.tb10282.x.
Savell, J. W. 2012. Beef carcass chilling: Current understanding, future challenges. A white paper on product enhancement research. National Cattlemen’s Beef Association, Centennial, CO.
Savell, J. W., T. R. Dutson, G. C. Smith, and Z. L. Carpenter. 1978. Structural changes in electrically stimulated beef muscle. J. Food Sci. 43:1606–1609. doi: https://doi.org/10.1111/j.1365-2621.1978.tb02553.x.
Sleper, P. S., M. C. Hunt, D. H. Kropf, C. L. Kastner, and M. E. Dikeman. 1983. Electrical stimulation effects on myoglobin properties of bovine longissimus muscle. J. Food Sci. 48:479–483. doi: https://doi.org/10.1111/j.1365-2621.1983.tb10771.x.
Smith, G. C. 1985. Effects of electrical stimulation on meat color, grade, heat ring and palatability. In: T. R. Dutson, and A. M. Pearson, editors, Advances in meat research. AVI Publishing Company, Inc., Westport, CT. p. 121–158.
Smith, G. C., K. E. Belk, J. N. Sofos, J. D. Tatum, and S. N. Williams. 2000. Economic implications of improved color stability in beef. In: E. A. Decker, C. Fautsman, and C. J. Lopez-Bote, editors, Antioxidants in muscle foods: Nutritional strategies to improve quality. Wiley Inter-Science, New York. p. 397–426.
Smulders, F. J. M., B. B. Marsh, D. R. Swartz, R. L Russell, and M. E. Hoenecke. 1990. Beef tenderness and sarcomere length. Meat Sci. 28:349–363. doi: https://doi.org/10.1016/0309-1740(90)90048-B.
Snedecor, G. W., and Cochran, W. G. 1980. Statistical methods. 7th edition. 507: Iowa State University Press.
Strydom, P. E., and L. Frylinck. 2014. Minimal electrical stimulation is effective in low stressed and well-fed cattle. Meat Sci. 96:790–798. doi: https://doi.org/10.1016/j.meatsci.2013.09.025.
Swatland, H. J. 1993. Explaining the P in PSE. Optical properties of meat. Meat Focus International 2. p. 362–367. https://meatscience.org/docs/default-source/publications-resources/rmc/2012/23_swatland_r2.pdf?sfvrsn=0.
Tarrant, P. V. 1989. Animal behavior and environment in the dark cutting condition. In: S. U. Fabianson., W. R. Shorthose, and R. D. Warner, editors, Dark cutting in cattle and sheep. Australian Meat & Livestock Research and Development Corporation, Sdney, Australia. p. 8–18.
Thompson, J. 2002. Managing meat tenderness. Meat Sci. 62:295–308. doi: https://doi.org/10.1016/s0309-1740(02)00126-2.
Toohey, E. S., D. L. Hopkins, D. F. Stanley, and S. G. Nielsen. 2008. The impact of new generation pre-dressing medium-voltage electrical stimulation on tenderness and color stability in meat. Meat Sci. 79:683–691. doi: https://doi.org/10.1016/j.meatsci.2007.10.036.
Unruh, J. A., C. L. Kastner, D. H. Kropf, M. E. Dikeman, and M. C. Hunt. 1986. Effects of low voltage stimulation during exsanguinations on meat quality and display color stability. Meat Sci. 18:281–293. doi: https://doi.org/10.1016/0309-1740(86)90018-5.
Van Laack, R. I. J. M., and R. G. Kauffman. 1999. Glycolytic potential of red, soft, exudative pork longissimus muscle. J. Anim. Sci. 77:2971–2973. doi: https://doi.org/10.2527/1999.77112971x.
Van Laack, H. L. J. M., and F. J. M. Smulders. 1990. Color stability of bovine longissimus dorsi and psoars major muscle as affected by electrical stimulation and hot boning. Meat Sci. 28:211–221. doi: https://doi.org/10.1016/0309-1740(90)90005-Q.
Vasconcelos, J. T., R. J. Rathmans, R. R. Reuter, J. Leibovich, J. P. McMeniman, K. E. Hales, T. L. Covey, M. F. Miller, W. T. Nicholas, and M. L. Galyean. 2008. Effects of duration of zilpaterol hydrochloride feeding and days on the finishing diet on feedlot cattle performance and carcass traits. J. Anim. Sci. 86:2005–2015. doi: https://doi.org/10.2527/jas.2008-1032.
Wu, W., Y. Fu, M. Therkildsen, X. M. Li, and R. T. Dai. 2014. Molecular understanding of meat quality though application of proteomics. Food Rev. Int. 31:13–28. doi: https://doi.org/10.1080/87559129.2014.961073.
Wulf, D. M., R. S. Emnett, J. M. Leheska, and S. J. Moeller. 2002. Relationship among glycolytic potential, dark firm cutting (dark, firm & dry) beef and cooked beef palatability. J. Anim. Sci. 80:1895–1903. doi: https://doi.org/10.2527/2002.8071895x.
Wulf, D. M., S. F. O’Connor, J. D. Tatum, and G. C. Smith. 1997. Using objective measures of color to predict beef longissimus tenderness. J. Anim. Sci. 75:685–692. doi: https://doi.org/10.2527/1997.753684x.
Young, O. A., A. Priolo, N. J. Simmons, and J. West. 1999. Effects of rigor attainment temperatures on meat blooming and color on display. Meat Sci. 52:47–56. doi: https://doi.org/10.1016/s0309-1740(98)00147-8.